
December 31, 2024, 2023 and 2022 Financial Statements As at December 31, 2024 and 2023 and for the years ended
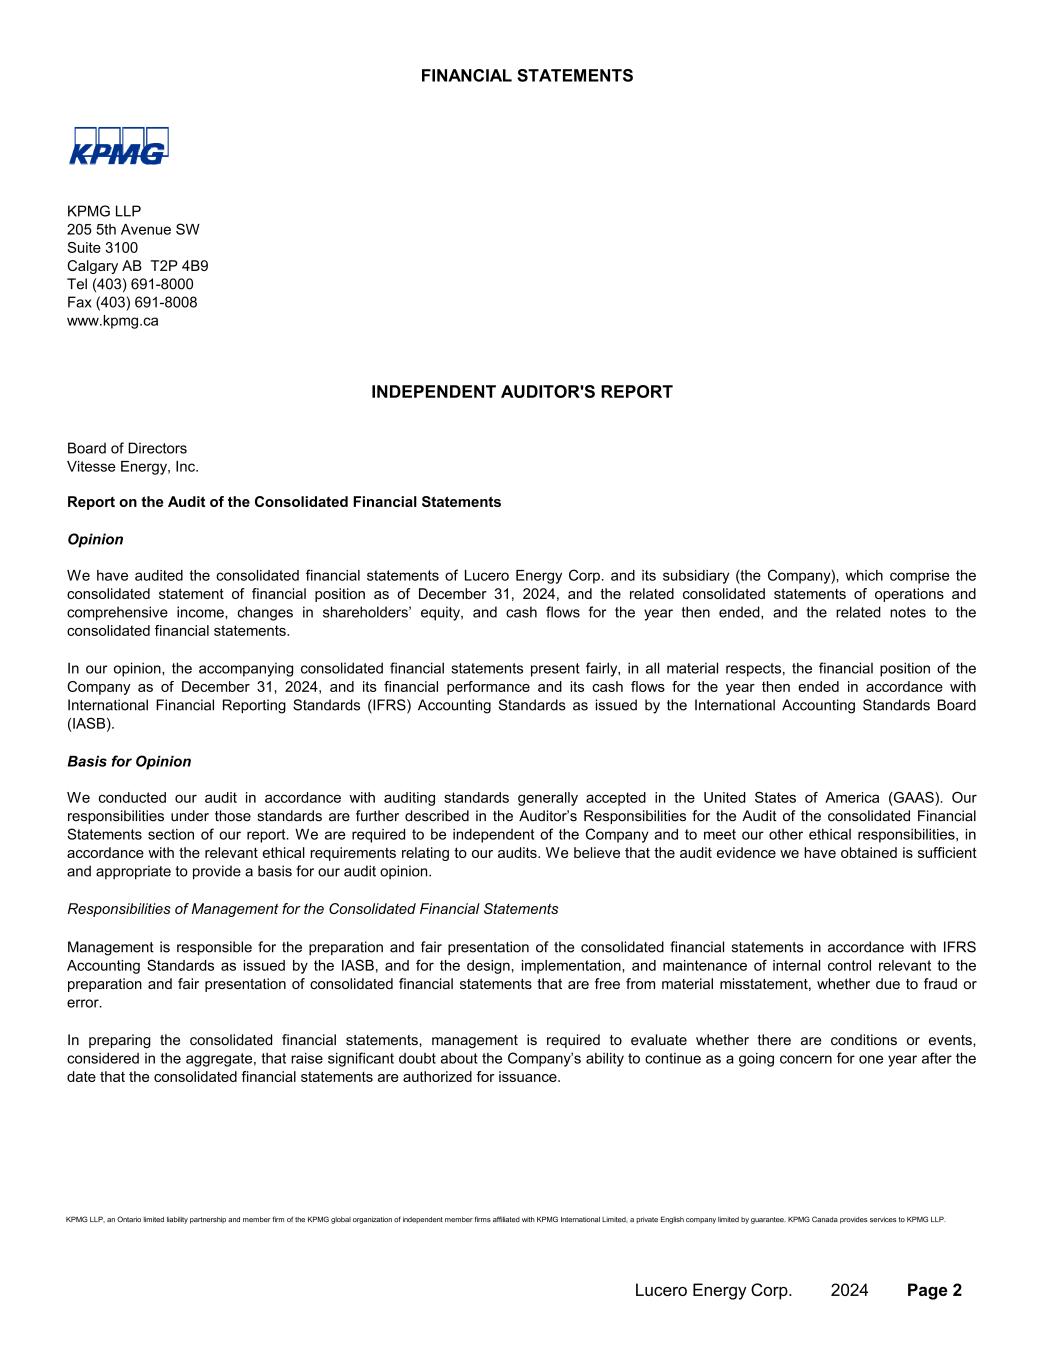
FINANCIAL STATEMENTS Board of Directors Vitesse Energy, Inc. Report on the Audit of the Consolidated Financial Statements Opinion Basis for Opinion KPMG LLP, an Ontario limited liability partnership and member firm of the KPMG global organization of independent member firms affiliated with KPMG International Limited, a private English company limited by guarantee. KPMG Canada provides services to KPMG LLP. Management is responsible for the preparation and fair presentation of the consolidated financial statements in accordance with IFRS Accounting Standards as issued by the IASB, and for the design, implementation, and maintenance of internal control relevant to the preparation and fair presentation of consolidated financial statements that are free from material misstatement, whether due to fraud or error. In preparing the consolidated financial statements, management is required to evaluate whether there are conditions or events, considered in the aggregate, that raise significant doubt about the Company’s ability to continue as a going concern for one year after the date that the consolidated financial statements are authorized for issuance. KPMG LLP 205 5th Avenue SW Suite 3100 Tel (403) 691-8000 Calgary AB T2P 4B9 INDEPENDENT AUDITOR'S REPORT Fax (403) 691-8008 www.kpmg.ca In our opinion, the accompanying consolidated financial statements present fairly, in all material respects, the financial position of the Company as of December 31, 2024, and its financial performance and its cash flows for the year then ended in accordance with International Financial Reporting Standards (IFRS) Accounting Standards as issued by the International Accounting Standards Board (IASB). We conducted our audit in accordance with auditing standards generally accepted in the United States of America (GAAS). Our responsibilities under those standards are further described in the Auditor’s Responsibilities for the Audit of the consolidated Financial Statements section of our report. We are required to be independent of the Company and to meet our other ethical responsibilities, in accordance with the relevant ethical requirements relating to our audits. We believe that the audit evidence we have obtained is sufficient and appropriate to provide a basis for our audit opinion. Responsibilities of Management for the Consolidated Financial Statements We have audited the consolidated financial statements of Lucero Energy Corp. and its subsidiary (the Company), which comprise the consolidated statement of financial position as of December 31, 2024, and the related consolidated statements of operations and comprehensive income, changes in shareholders’ equity, and cash flows for the year then ended, and the related notes to the consolidated financial statements. Lucero Energy Corp. 2024 Page 2
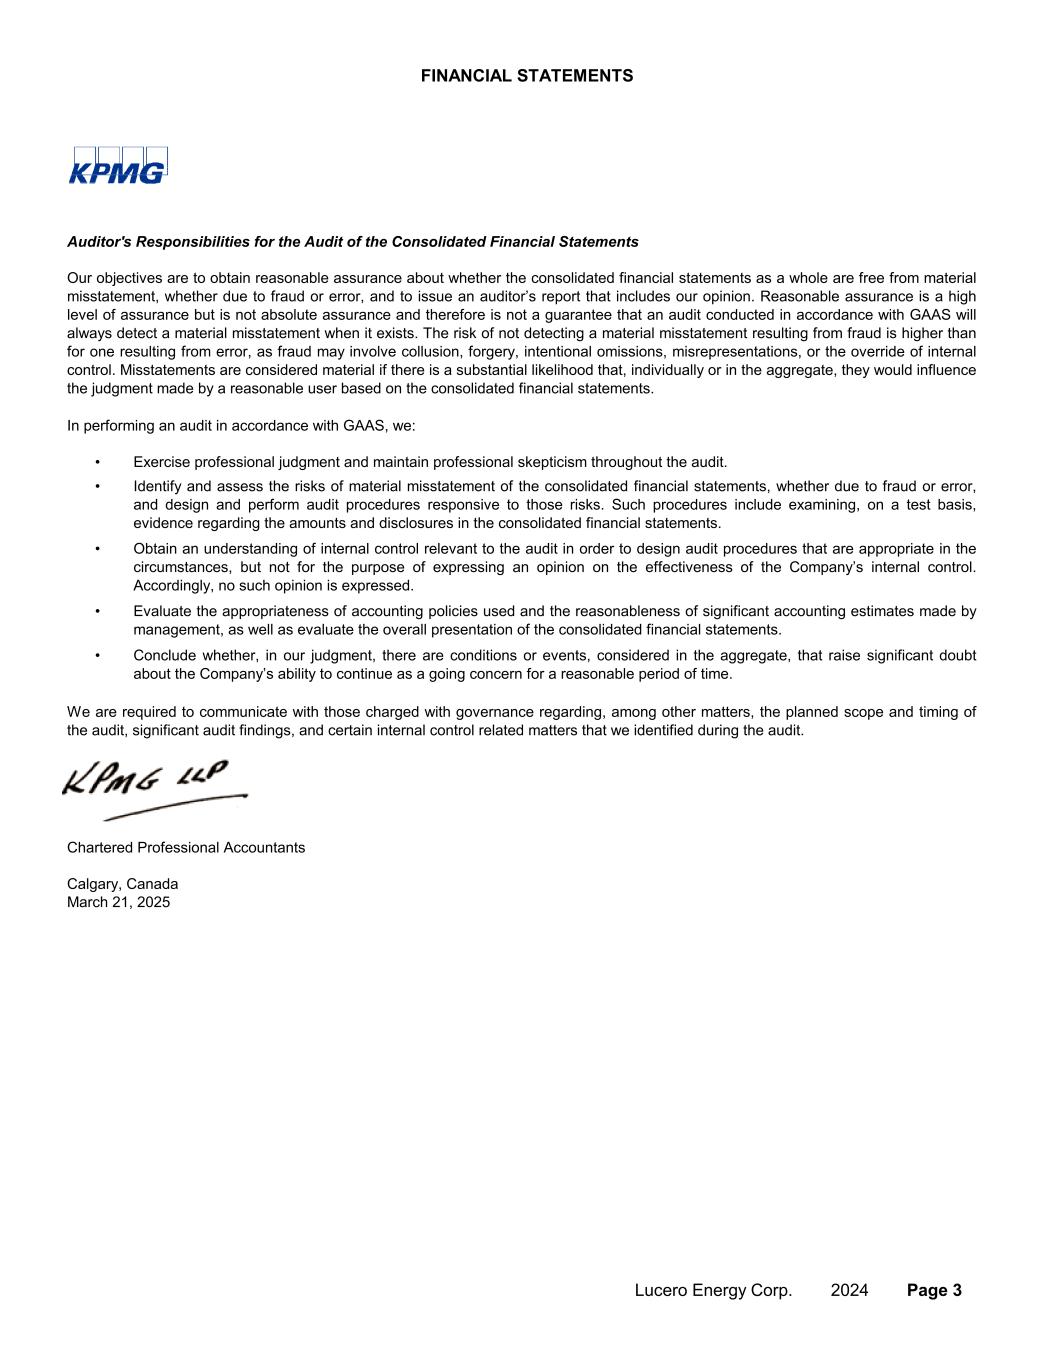
FINANCIAL STATEMENTS Auditor's Responsibilities for the Audit of the Consolidated Financial Statements • • • • • Chartered Professional Accountants Calgary, Canada March 21, 2025 We are required to communicate with those charged with governance regarding, among other matters, the planned scope and timing of the audit, significant audit findings, and certain internal control related matters that we identified during the audit. Evaluate the appropriateness of accounting policies used and the reasonableness of significant accounting estimates made by management, as well as evaluate the overall presentation of the consolidated financial statements. In performing an audit in accordance with GAAS, we: Exercise professional judgment and maintain professional skepticism throughout the audit. Identify and assess the risks of material misstatement of the consolidated financial statements, whether due to fraud or error, and design and perform audit procedures responsive to those risks. Such procedures include examining, on a test basis, evidence regarding the amounts and disclosures in the consolidated financial statements. Obtain an understanding of internal control relevant to the audit in order to design audit procedures that are appropriate in the circumstances, but not for the purpose of expressing an opinion on the effectiveness of the Company’s internal control. Accordingly, no such opinion is expressed. Conclude whether, in our judgment, there are conditions or events, considered in the aggregate, that raise significant doubt about the Company’s ability to continue as a going concern for a reasonable period of time. Our objectives are to obtain reasonable assurance about whether the consolidated financial statements as a whole are free from material misstatement, whether due to fraud or error, and to issue an auditor’s report that includes our opinion. Reasonable assurance is a high level of assurance but is not absolute assurance and therefore is not a guarantee that an audit conducted in accordance with GAAS will always detect a material misstatement when it exists. The risk of not detecting a material misstatement resulting from fraud is higher than for one resulting from error, as fraud may involve collusion, forgery, intentional omissions, misrepresentations, or the override of internal control. Misstatements are considered material if there is a substantial likelihood that, individually or in the aggregate, they would influence the judgment made by a reasonable user based on the consolidated financial statements. Lucero Energy Corp. 2024 Page 3
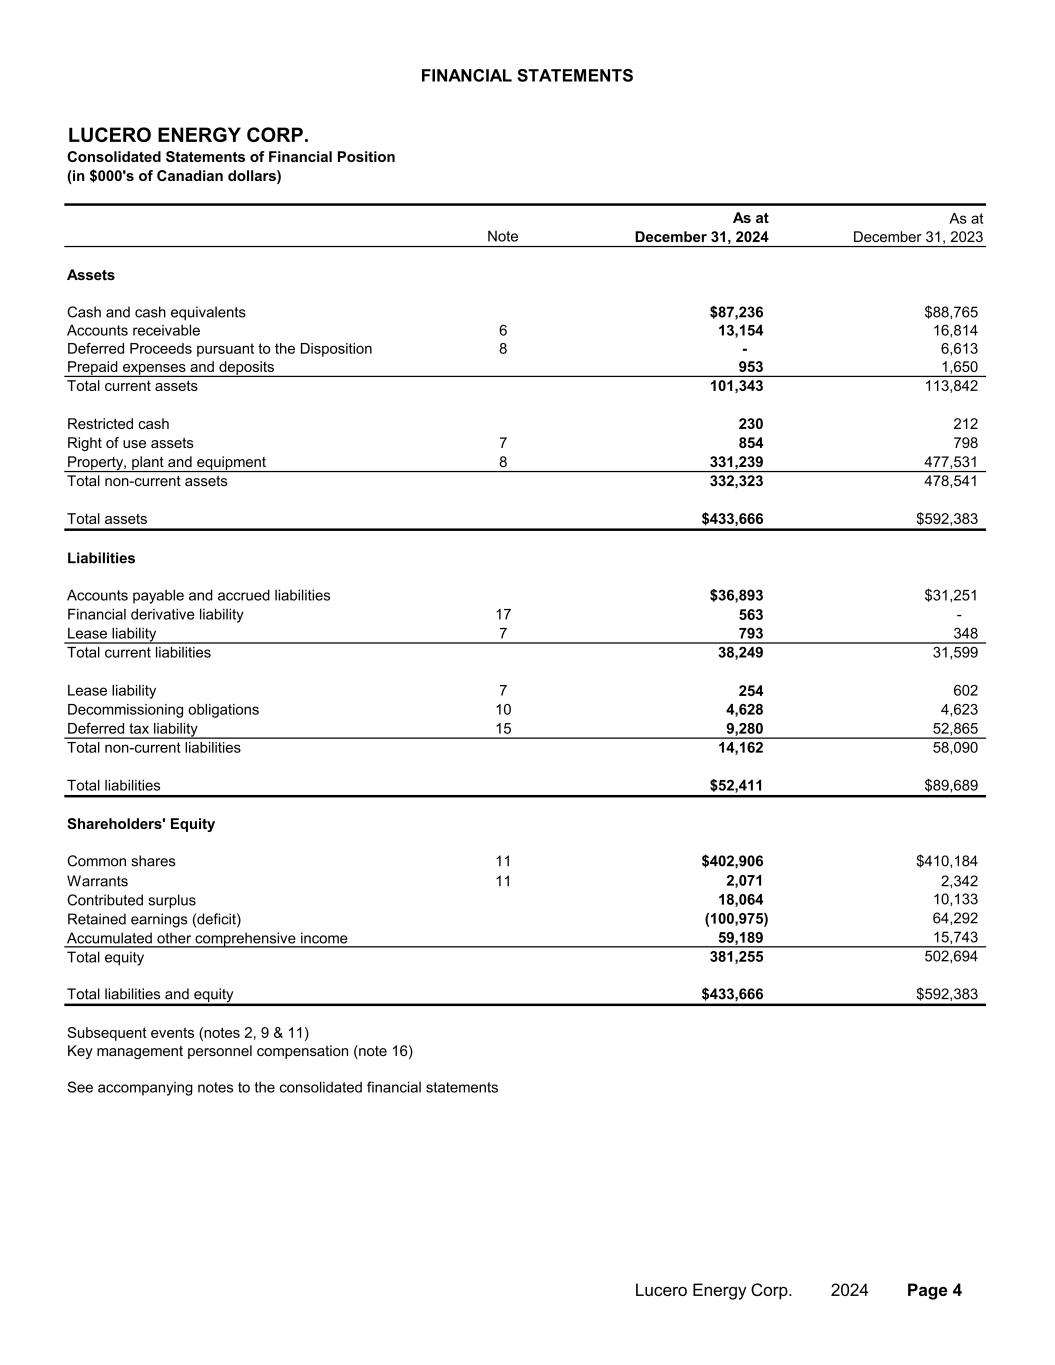
FINANCIAL STATEMENTS LUCERO ENERGY CORP. Consolidated Statements of Financial Position (in $000's of Canadian dollars) Note Assets Cash and cash equivalents $87,236 $88,765 Accounts receivable 6 13,154 16,814 Deferred Proceeds pursuant to the Disposition 8 - 6,613 Prepaid expenses and deposits 953 1,650 Total current assets 101,343 113,842 Restricted cash 230 212 Right of use assets 7 854 798 Property, plant and equipment 8 331,239 477,531 Total non-current assets 332,323 478,541 Total assets $433,666 $592,383 Liabilities Accounts payable and accrued liabilities $36,893 $31,251 Financial derivative liability 17 563 - Lease liability 7 793 348 Total current liabilities 38,249 31,599 Lease liability 7 254 602 Decommissioning obligations 10 4,628 4,623 Deferred tax liability 15 9,280 52,865 Total non-current liabilities 14,162 58,090 Total liabilities $52,411 $89,689 Shareholders' Equity Common shares 11 $402,906 $410,184 Warrants 11 2,071 2,342 Contributed surplus 18,064 10,133 Retained earnings (deficit) (100,975) 64,292 Accumulated other comprehensive income 59,189 15,743 Total equity 381,255 502,694 Total liabilities and equity $433,666 $592,383 Subsequent events (notes 2, 9 & 11) Key management personnel compensation (note 16) See accompanying notes to the consolidated financial statements As at December 31, 2023 As at December 31, 2024 Lucero Energy Corp. 2024 Page 4
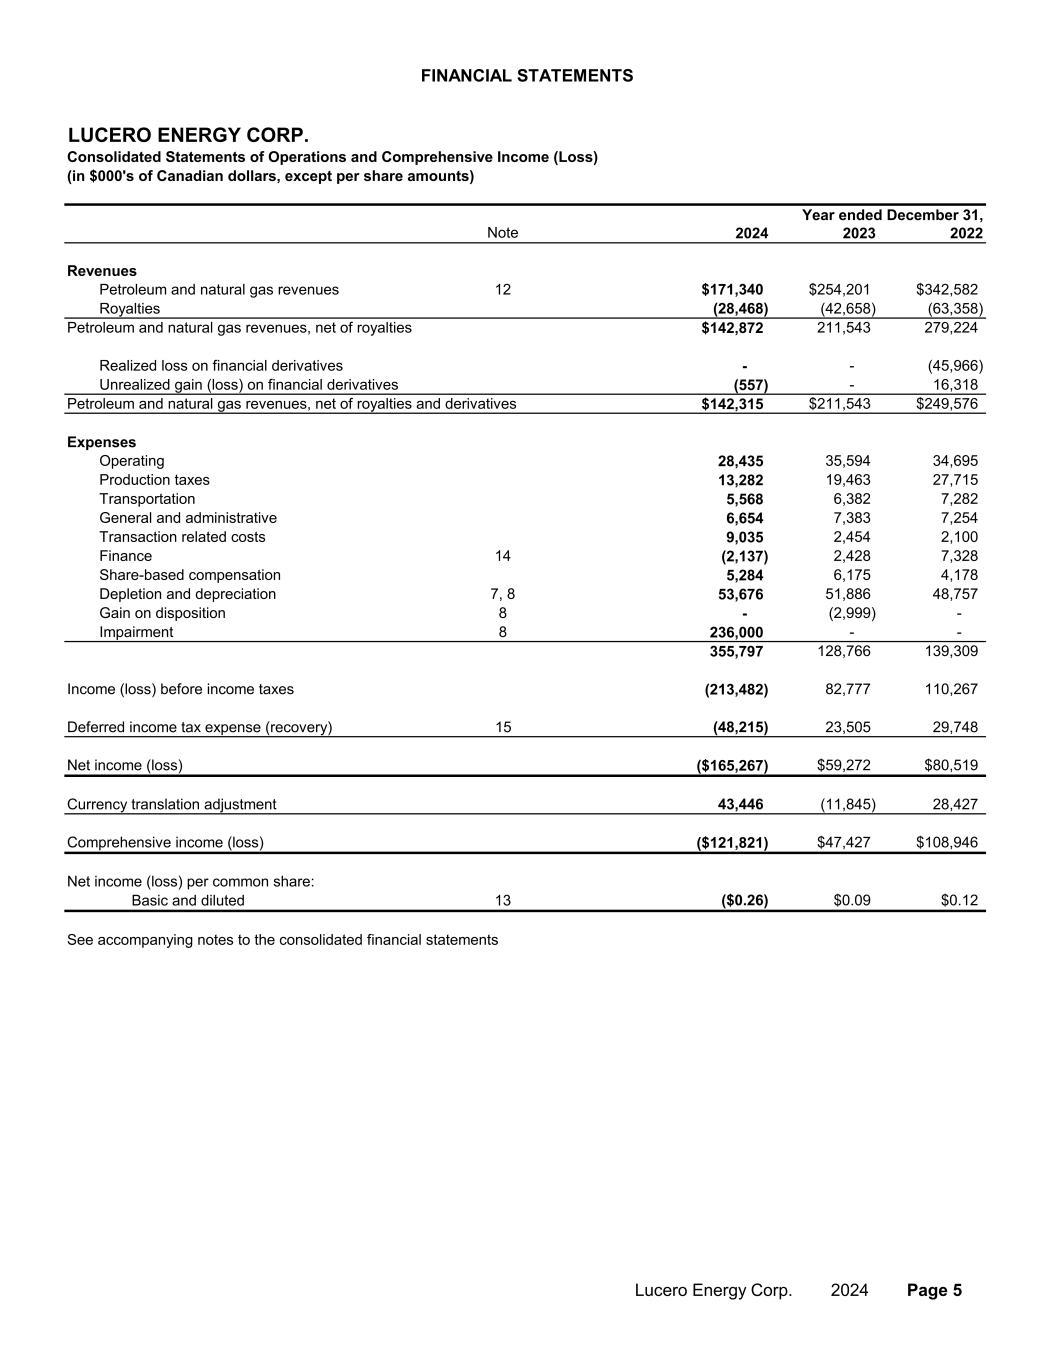
FINANCIAL STATEMENTS LUCERO ENERGY CORP. Consolidated Statements of Operations and Comprehensive Income (Loss) (in $000's of Canadian dollars, except per share amounts) Note 2023 2024 2023 2022 Revenues Petroleum and natural gas revenues 12 $58,680 $171,340 $254,201 $342,582 Royalties (9,439) (28,468) (42,658) (63,358) Petroleum and natural gas revenues, net of royalties 49,241 $142,872 211,543 279,224 Realized loss on financial derivatives - - - (45,966) Unrealized gain (loss) on financial derivatives - (557) - 16,318 Petroleum and natural gas revenues, net of royalties and derivatives 49,241 $142,315 $211,543 $249,576 Expenses Operating 8,163 28,435 35,594 34,695 Production taxes 4,390 13,282 19,463 27,715 Transportation 1,426 5,568 6,382 7,282 General and administrative 1,710 6,654 7,383 7,254 Transaction related costs - 9,035 2,454 2,100 Finance 14 (385) (2,137) 2,428 7,328 Share-based compensation 847 5,284 6,175 4,178 Depletion and depreciation 7, 8 12,559 53,676 51,886 48,757 Gain on disposition 8 (2,549) - (2,999) - Impairment 8 - 236,000 - - 26,161 355,797 128,766 139,309 Income (loss) before income taxes 23,080 (213,482) 82,777 110,267 Deferred income tax expense (recovery) 15 6,198 (48,215) 23,505 29,748 Net income (loss) $16,882 ($165,267) $59,272 $80,519 Currency translation adjustment (11,365) 43,446 (11,845) 28,427 Comprehensive income (loss) $5,517 ($121,821) $47,427 $108,946 Net income (loss) per common share: Basic and diluted 13 $0.03 ($0.26) $0.09 $0.12 See accompanying notes to the consolidated financial statements Three months Year ended December 31, Lucero Energy Corp. 2024 Page 5
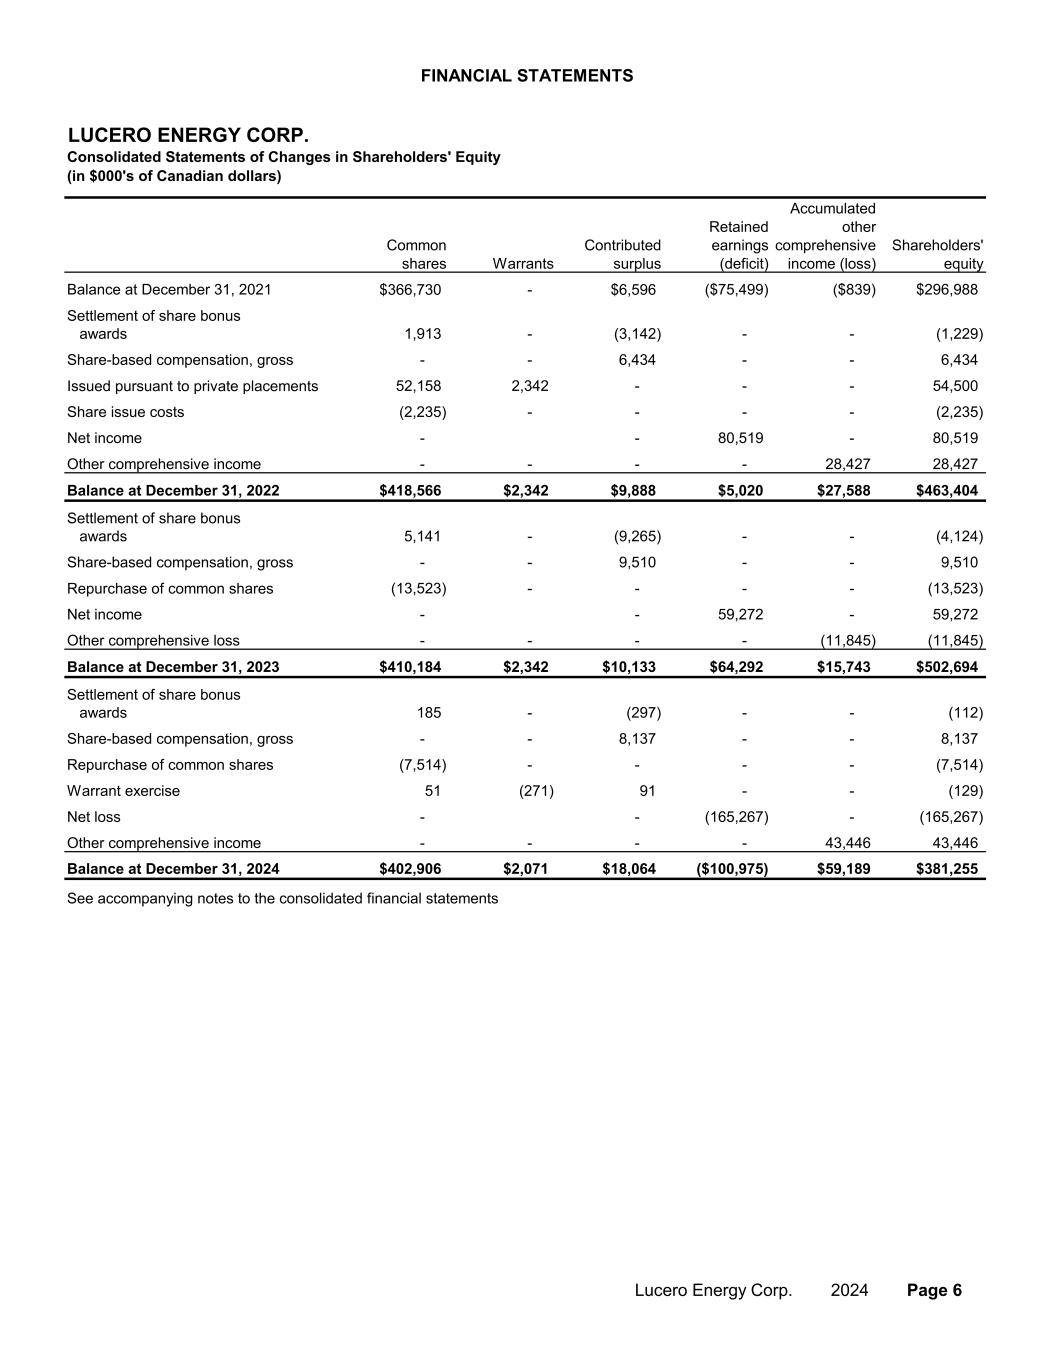
FINANCIAL STATEMENTS LUCERO ENERGY CORP. Consolidated Statements of Changes in Shareholders' Equity (in $000's of Canadian dollars) Common shares Warrants Contributed surplus Retained earnings (deficit) Accumulated other comprehensive income (loss) Shareholders' equity Balance at December 31, 2021 $366,730 - $6,596 ($75,499) ($839) $296,988 Settlement of share bonus awards 1,913 - (3,142) - - (1,229) Share-based compensation, gross - - 6,434 - - 6,434 Issued pursuant to private placements 52,158 2,342 - - - 54,500 Share issue costs (2,235) - - - - (2,235) Net income - - 80,519 - 80,519 Other comprehensive income - - - - 28,427 28,427 Balance at December 31, 2022 $418,566 $2,342 $9,888 $5,020 $27,588 $463,404 Settlement of share bonus awards 5,141 - (9,265) - - (4,124) Share-based compensation, gross - - 9,510 - - 9,510 Repurchase of common shares (13,523) - - - - (13,523) Net income - - 59,272 - 59,272 Other comprehensive loss - - - - (11,845) (11,845) Balance at December 31, 2023 $410,184 $2,342 $10,133 $64,292 $15,743 $502,694 Settlement of share bonus awards 185 - (297) - - (112) Share-based compensation, gross - - 8,137 - - 8,137 Repurchase of common shares (7,514) - - - - (7,514) Warrant exercise 51 (271) 91 - - (129) Net loss - - (165,267) - (165,267) Other comprehensive income - - - - 43,446 43,446 Balance at December 31, 2024 $402,906 $2,071 $18,064 ($100,975) $59,189 $381,255 See accompanying notes to the consolidated financial statements Lucero Energy Corp. 2024 Page 6
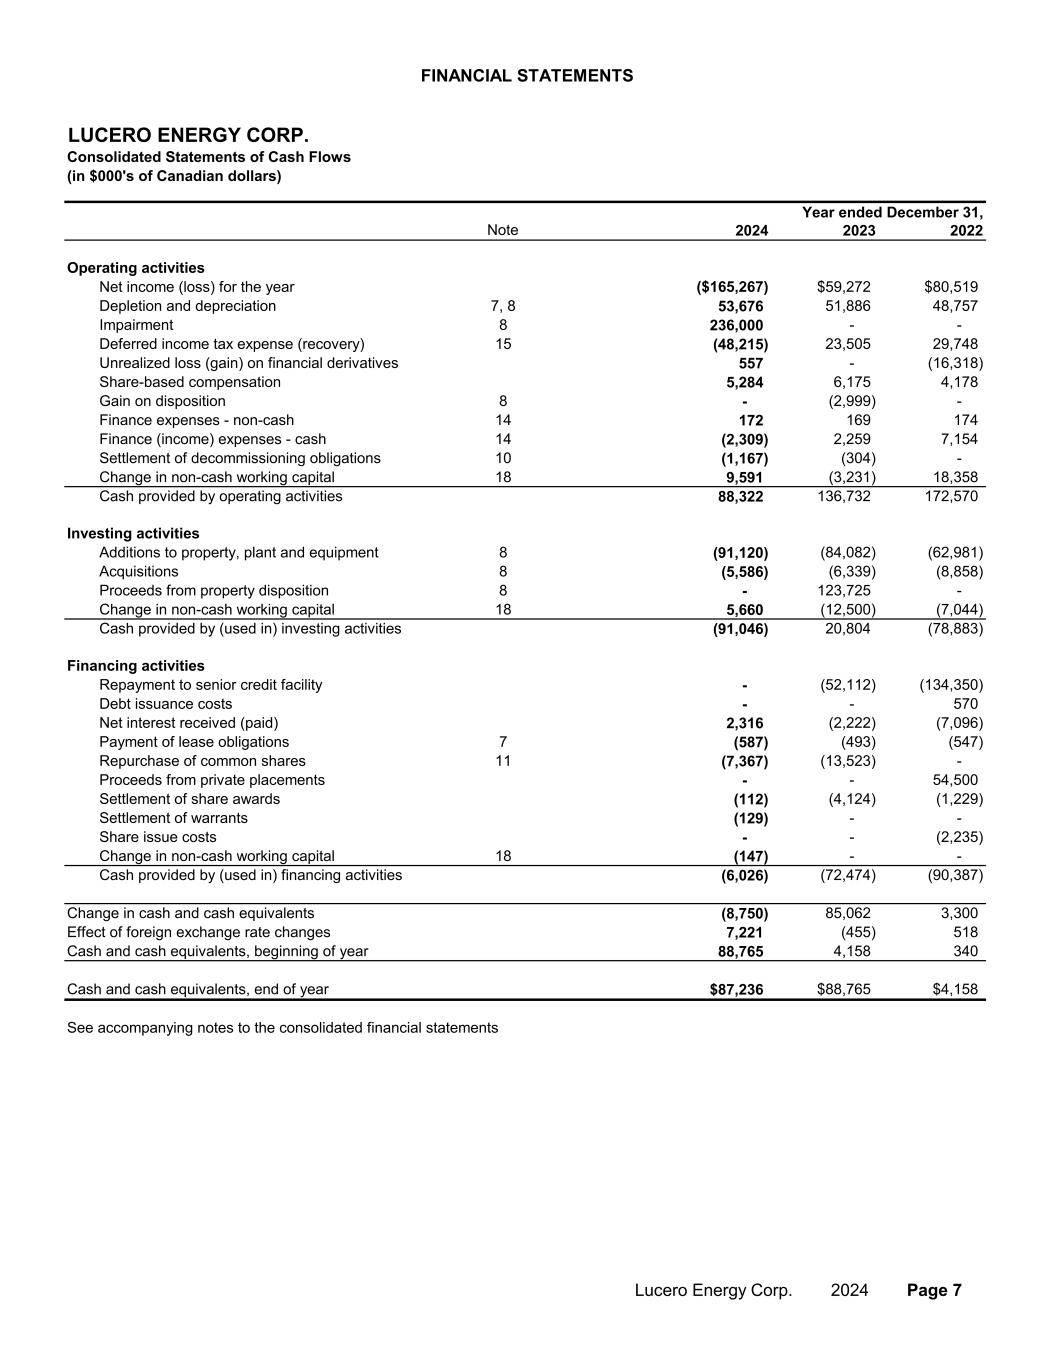
FINANCIAL STATEMENTS LUCERO ENERGY CORP. Consolidated Statements of Cash Flows (in $000's of Canadian dollars) Note 2023 2024 2023 2022 Operating activities Net income (loss) for the year $16,882 ($165,267) $59,272 $80,519 Depletion and depreciation 7, 8 12,559 53,676 51,886 48,757 Impairment 8 - 236,000 - - Deferred income tax expense (recovery) 15 6,198 (48,215) 23,505 29,748 Unrealized loss (gain) on financial derivatives - 557 - (16,318) Share-based compensation 847 5,284 6,175 4,178 Gain on disposition 8 (2,549) - (2,999) - Finance expenses - non-cash 14 39 172 169 174 Finance (income) expenses - cash 14 (424) (2,309) 2,259 7,154 Settlement of decommissioning obligations 10 - (1,167) (304) - Change in non-cash working capital 18 (1,317) 9,591 (3,231) 18,358 Cash provided by operating activities 32,235 88,322 136,732 172,570 Investing activities Additions to property, plant and equipment 8 (4,579) (91,120) (84,082) (62,981) Acquisitions 8 - (5,586) (6,339) (8,858) Proceeds from property disposition 8 4,143 - 123,725 - Change in non-cash working capital 18 (5,500) 5,660 (12,500) (7,044) Cash provided by (used in) investing activities (5,936) (91,046) 20,804 (78,883) Financing activities Repayment to senior credit facility - - (52,112) (134,350) Debt issuance costs - - - 570 Net interest received (paid) 422 2,316 (2,222) (7,096) Payment of lease obligations 7 (126) (587) (493) (547) Repurchase of common shares 11 (1,486) (7,367) (13,523) - Proceeds from private placements - - - 54,500 Settlement of share awards - (112) (4,124) (1,229) Settlement of warrants - (129) - - Share issue costs - - - (2,235) Change in non-cash working capital 18 - (147) - - Cash provided by (used in) financing activities (1,190) (6,026) (72,474) (90,387) Change in cash and cash equivalents 25,109 (8,750) 85,062 3,300 Effect of foreign exchange rate changes (1,986) 7,221 (455) 518 Cash and cash equivalents, beginning of year 65,642 88,765 4,158 340 Cash and cash equivalents, end of year $88,765 $87,236 $88,765 $4,158 See accompanying notes to the consolidated financial statements Three months Year ended December 31, Lucero Energy Corp. 2024 Page 7
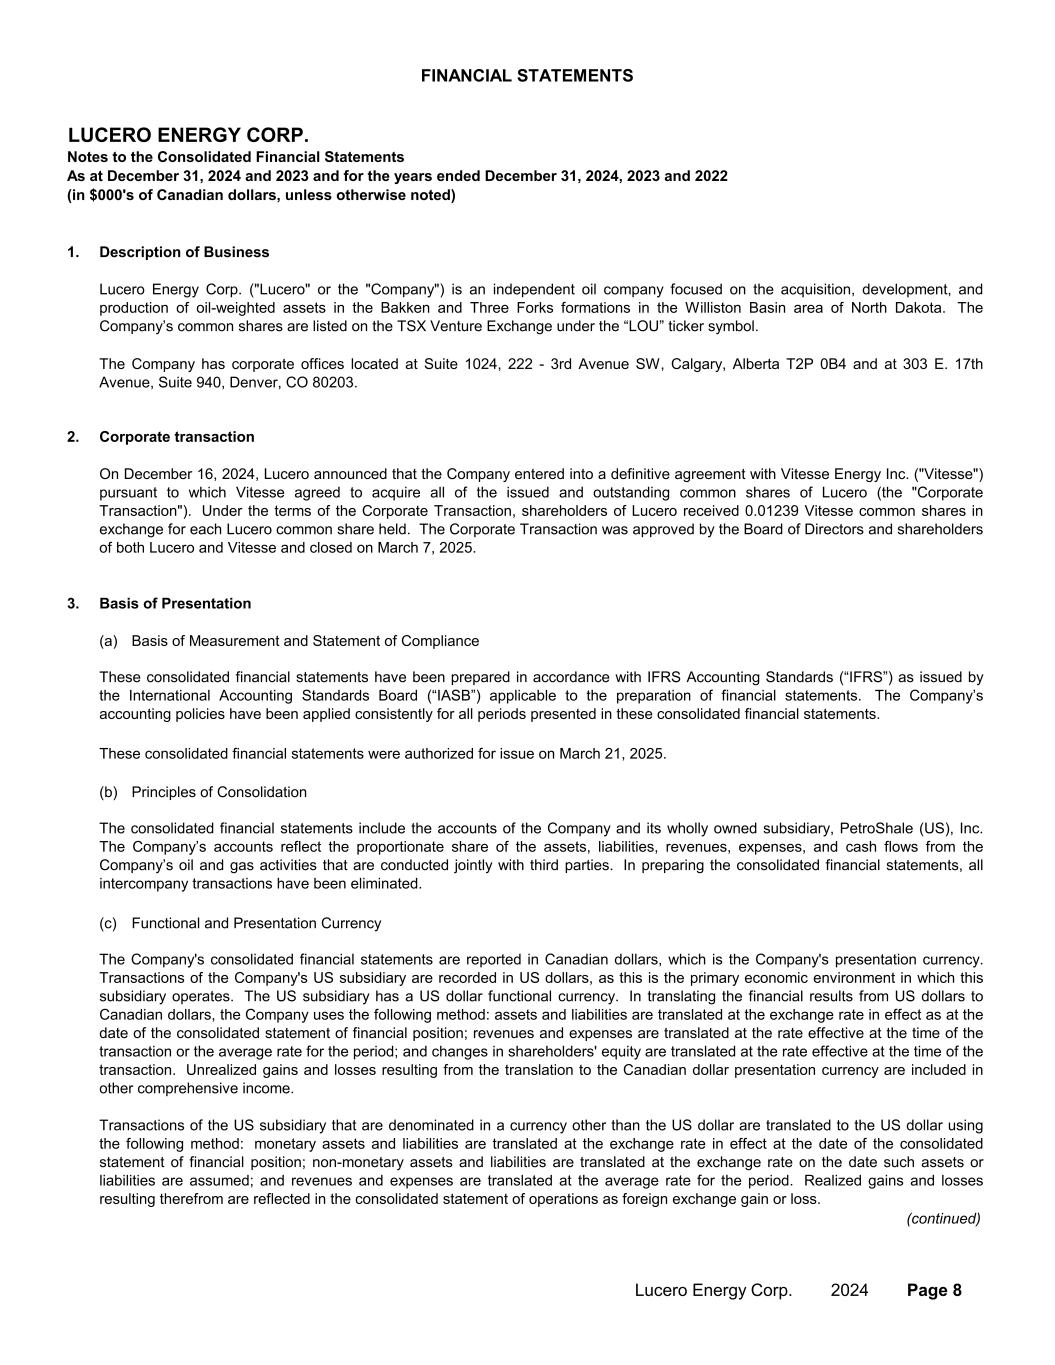
FINANCIAL STATEMENTS LUCERO ENERGY CORP. Notes to the Consolidated Financial Statements (in $000's of Canadian dollars, unless otherwise noted) 1. Description of Business 2. Corporate transaction 3. Basis of Presentation (a) Basis of Measurement and Statement of Compliance (continued) Lucero Energy Corp. ("Lucero" or the "Company") is an independent oil company focused on the acquisition, development, and production of oil-weighted assets in the Bakken and Three Forks formations in the Williston Basin area of North Dakota. The Company’s common shares are listed on the TSX Venture Exchange under the “LOU” ticker symbol. As at December 31, 2024 and 2023 and for the years ended December 31, 2024, 2023 and 2022 On December 16, 2024, Lucero announced that the Company entered into a definitive agreement with Vitesse Energy Inc. ("Vitesse") pursuant to which Vitesse agreed to acquire all of the issued and outstanding common shares of Lucero (the "Corporate Transaction"). Under the terms of the Corporate Transaction, shareholders of Lucero received 0.01239 Vitesse common shares in exchange for each Lucero common share held. The Corporate Transaction was approved by the Board of Directors and shareholders of both Lucero and Vitesse and closed on March 7, 2025. The Company has corporate offices located at Suite 1024, 222 - 3rd Avenue SW, Calgary, Alberta T2P 0B4 and at 303 E. 17th Avenue, Suite 940, Denver, CO 80203. These consolidated financial statements have been prepared in accordance with IFRS Accounting Standards (“IFRS”) as issued by the International Accounting Standards Board (“IASB”) applicable to the preparation of financial statements. The Company’s accounting policies have been applied consistently for all periods presented in these consolidated financial statements. These consolidated financial statements were authorized for issue on March 21, 2025. (b) Principles of Consolidation The consolidated financial statements include the accounts of the Company and its wholly owned subsidiary, PetroShale (US), Inc. The Company’s accounts reflect the proportionate share of the assets, liabilities, revenues, expenses, and cash flows from the Company’s oil and gas activities that are conducted jointly with third parties. In preparing the consolidated financial statements, all intercompany transactions have been eliminated. (c) Functional and Presentation Currency The Company's consolidated financial statements are reported in Canadian dollars, which is the Company's presentation currency. Transactions of the Company's US subsidiary are recorded in US dollars, as this is the primary economic environment in which this subsidiary operates. The US subsidiary has a US dollar functional currency. In translating the financial results from US dollars to Canadian dollars, the Company uses the following method: assets and liabilities are translated at the exchange rate in effect as at the date of the consolidated statement of financial position; revenues and expenses are translated at the rate effective at the time of the transaction or the average rate for the period; and changes in shareholders' equity are translated at the rate effective at the time of the transaction. Unrealized gains and losses resulting from the translation to the Canadian dollar presentation currency are included in other comprehensive income. Transactions of the US subsidiary that are denominated in a currency other than the US dollar are translated to the US dollar using the following method: monetary assets and liabilities are translated at the exchange rate in effect at the date of the consolidated statement of financial position; non-monetary assets and liabilities are translated at the exchange rate on the date such assets or liabilities are assumed; and revenues and expenses are translated at the average rate for the period. Realized gains and losses resulting therefrom are reflected in the consolidated statement of operations as foreign exchange gain or loss. Lucero Energy Corp. 2024 Page 8
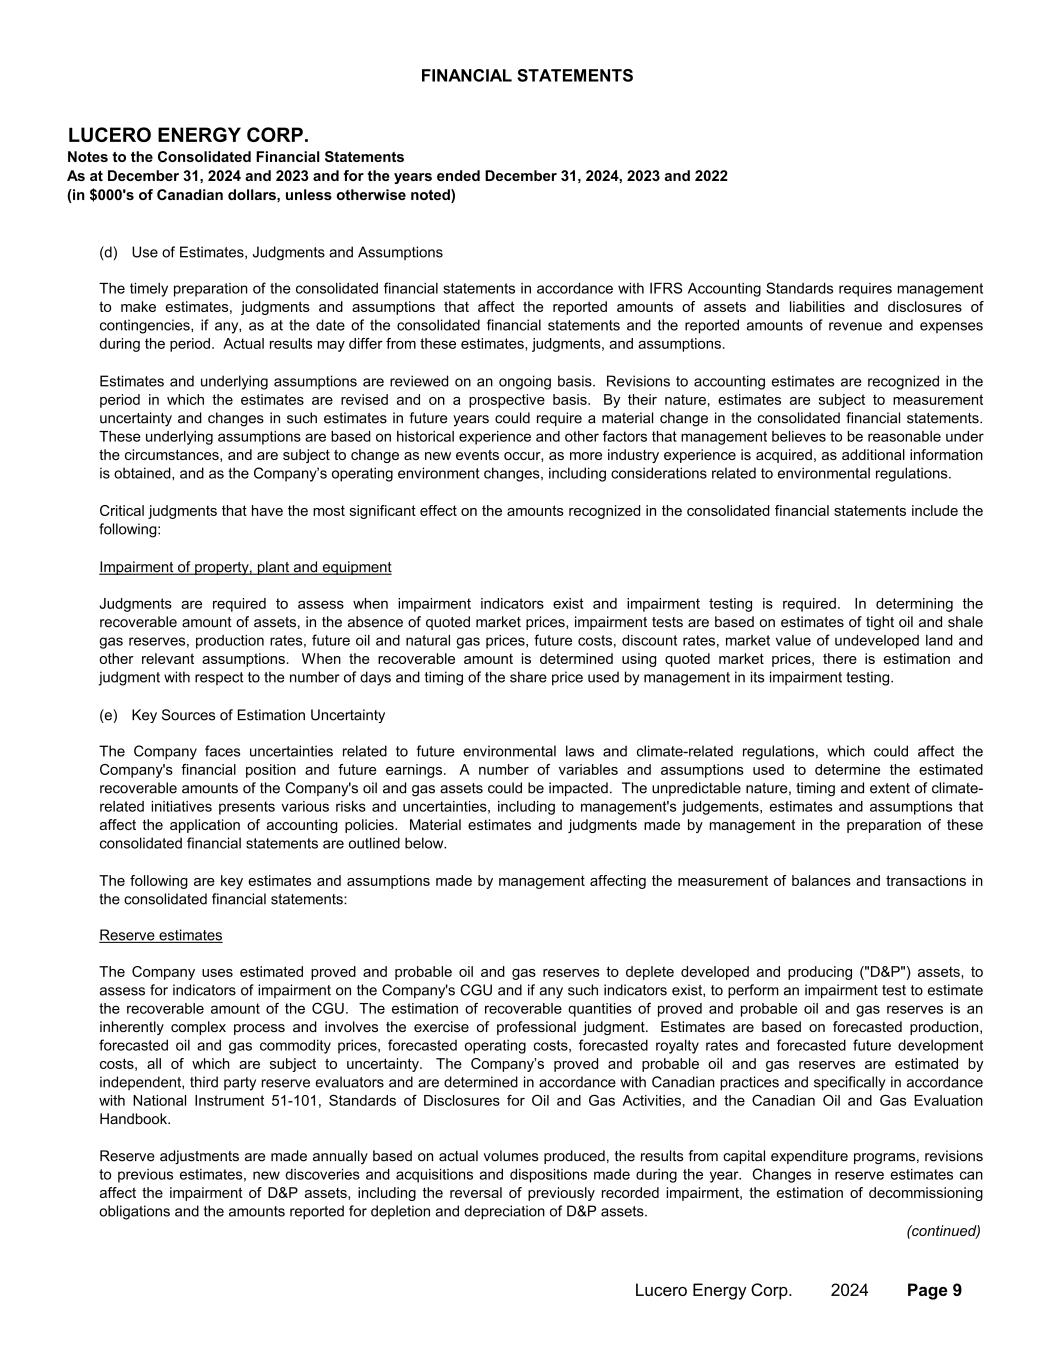
FINANCIAL STATEMENTS LUCERO ENERGY CORP. Notes to the Consolidated Financial Statements (in $000's of Canadian dollars, unless otherwise noted) As at December 31, 2024 and 2023 and for the years ended December 31, 2024, 2023 and 2022 (d) Use of Estimates, Judgments and Assumptions (e) Key Sources of Estimation Uncertainty (continued) Impairment of property, plant and equipment The timely preparation of the consolidated financial statements in accordance with IFRS Accounting Standards requires management to make estimates, judgments and assumptions that affect the reported amounts of assets and liabilities and disclosures of contingencies, if any, as at the date of the consolidated financial statements and the reported amounts of revenue and expenses during the period. Actual results may differ from these estimates, judgments, and assumptions. Estimates and underlying assumptions are reviewed on an ongoing basis. Revisions to accounting estimates are recognized in the period in which the estimates are revised and on a prospective basis. By their nature, estimates are subject to measurement uncertainty and changes in such estimates in future years could require a material change in the consolidated financial statements. These underlying assumptions are based on historical experience and other factors that management believes to be reasonable under the circumstances, and are subject to change as new events occur, as more industry experience is acquired, as additional information is obtained, and as the Company’s operating environment changes, including considerations related to environmental regulations. Reserve estimates Judgments are required to assess when impairment indicators exist and impairment testing is required. In determining the recoverable amount of assets, in the absence of quoted market prices, impairment tests are based on estimates of tight oil and shale gas reserves, production rates, future oil and natural gas prices, future costs, discount rates, market value of undeveloped land and other relevant assumptions. When the recoverable amount is determined using quoted market prices, there is estimation and judgment with respect to the number of days and timing of the share price used by management in its impairment testing. The following are key estimates and assumptions made by management affecting the measurement of balances and transactions in the consolidated financial statements: Critical judgments that have the most significant effect on the amounts recognized in the consolidated financial statements include the following: The Company faces uncertainties related to future environmental laws and climate-related regulations, which could affect the Company's financial position and future earnings. A number of variables and assumptions used to determine the estimated recoverable amounts of the Company's oil and gas assets could be impacted. The unpredictable nature, timing and extent of climate- related initiatives presents various risks and uncertainties, including to management's judgements, estimates and assumptions that affect the application of accounting policies. Material estimates and judgments made by management in the preparation of these consolidated financial statements are outlined below. The Company uses estimated proved and probable oil and gas reserves to deplete developed and producing ("D&P") assets, to assess for indicators of impairment on the Company's CGU and if any such indicators exist, to perform an impairment test to estimate the recoverable amount of the CGU. The estimation of recoverable quantities of proved and probable oil and gas reserves is an inherently complex process and involves the exercise of professional judgment. Estimates are based on forecasted production, forecasted oil and gas commodity prices, forecasted operating costs, forecasted royalty rates and forecasted future development costs, all of which are subject to uncertainty. The Company’s proved and probable oil and gas reserves are estimated by independent, third party reserve evaluators and are determined in accordance with Canadian practices and specifically in accordance with National Instrument 51-101, Standards of Disclosures for Oil and Gas Activities, and the Canadian Oil and Gas Evaluation Handbook. Reserve adjustments are made annually based on actual volumes produced, the results from capital expenditure programs, revisions to previous estimates, new discoveries and acquisitions and dispositions made during the year. Changes in reserve estimates can affect the impairment of D&P assets, including the reversal of previously recorded impairment, the estimation of decommissioning obligations and the amounts reported for depletion and depreciation of D&P assets. Lucero Energy Corp. 2024 Page 9
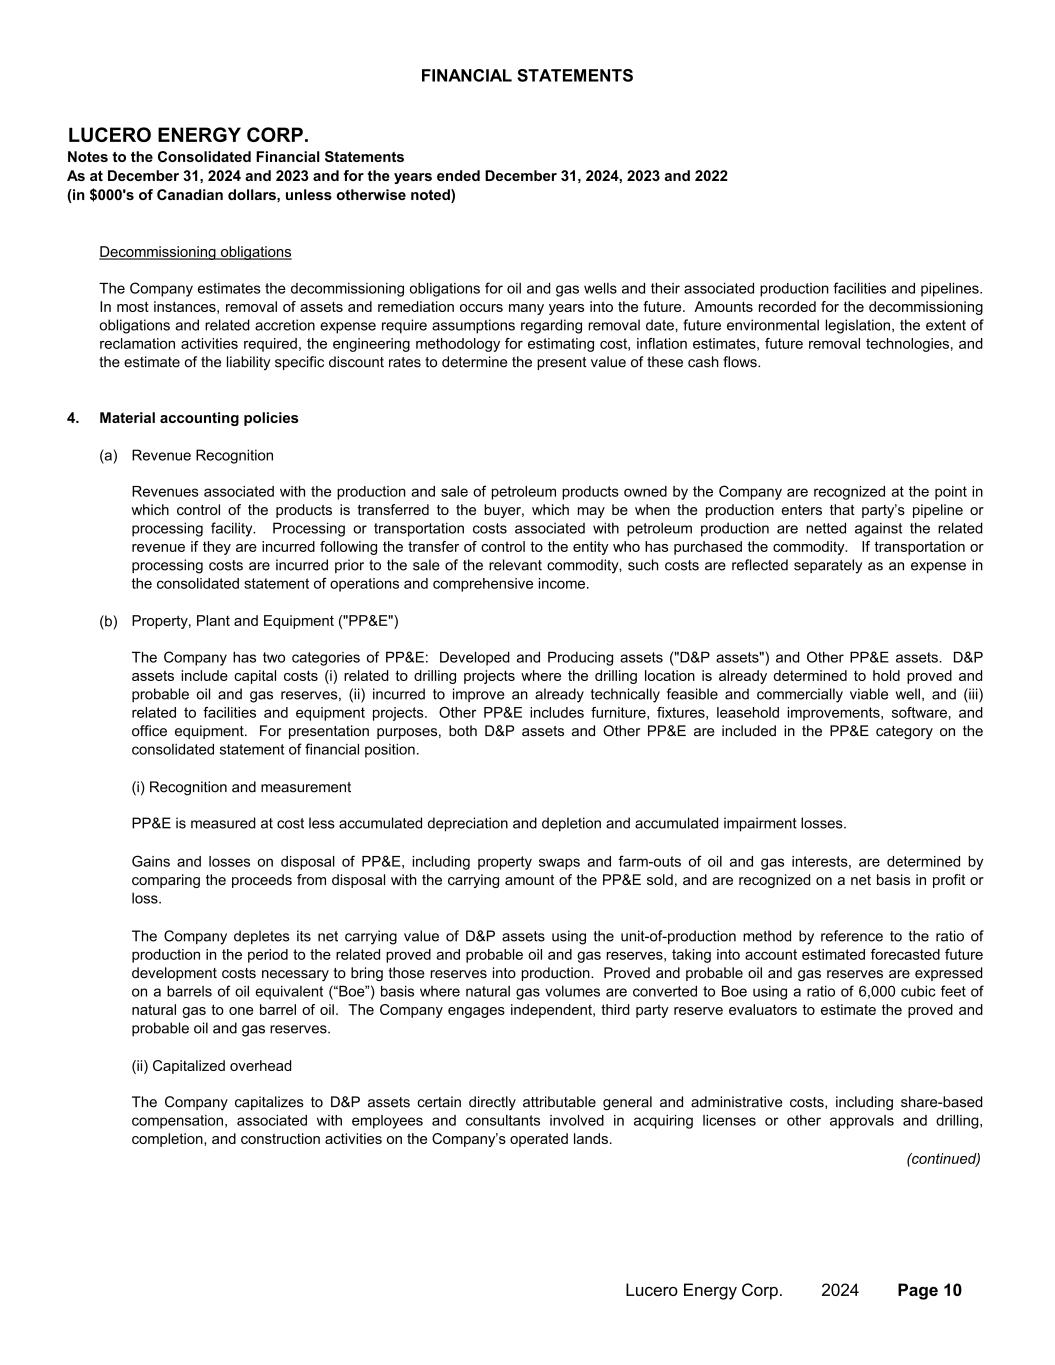
FINANCIAL STATEMENTS LUCERO ENERGY CORP. Notes to the Consolidated Financial Statements (in $000's of Canadian dollars, unless otherwise noted) As at December 31, 2024 and 2023 and for the years ended December 31, 2024, 2023 and 2022 4. Material accounting policies (a) Revenue Recognition (b) (i) Recognition and measurement (ii) Capitalized overhead (continued) Decommissioning obligations The Company estimates the decommissioning obligations for oil and gas wells and their associated production facilities and pipelines. In most instances, removal of assets and remediation occurs many years into the future. Amounts recorded for the decommissioning obligations and related accretion expense require assumptions regarding removal date, future environmental legislation, the extent of reclamation activities required, the engineering methodology for estimating cost, inflation estimates, future removal technologies, and the estimate of the liability specific discount rates to determine the present value of these cash flows. Property, Plant and Equipment ("PP&E") PP&E is measured at cost less accumulated depreciation and depletion and accumulated impairment losses. The Company has two categories of PP&E: Developed and Producing assets ("D&P assets") and Other PP&E assets. D&P assets include capital costs (i) related to drilling projects where the drilling location is already determined to hold proved and probable oil and gas reserves, (ii) incurred to improve an already technically feasible and commercially viable well, and (iii) related to facilities and equipment projects. Other PP&E includes furniture, fixtures, leasehold improvements, software, and office equipment. For presentation purposes, both D&P assets and Other PP&E are included in the PP&E category on the consolidated statement of financial position. Gains and losses on disposal of PP&E, including property swaps and farm-outs of oil and gas interests, are determined by comparing the proceeds from disposal with the carrying amount of the PP&E sold, and are recognized on a net basis in profit or loss. The Company capitalizes to D&P assets certain directly attributable general and administrative costs, including share-based compensation, associated with employees and consultants involved in acquiring licenses or other approvals and drilling, completion, and construction activities on the Company’s operated lands. Revenues associated with the production and sale of petroleum products owned by the Company are recognized at the point in which control of the products is transferred to the buyer, which may be when the production enters that party’s pipeline or processing facility. Processing or transportation costs associated with petroleum production are netted against the related revenue if they are incurred following the transfer of control to the entity who has purchased the commodity. If transportation or processing costs are incurred prior to the sale of the relevant commodity, such costs are reflected separately as an expense in the consolidated statement of operations and comprehensive income. The Company depletes its net carrying value of D&P assets using the unit-of-production method by reference to the ratio of production in the period to the related proved and probable oil and gas reserves, taking into account estimated forecasted future development costs necessary to bring those reserves into production. Proved and probable oil and gas reserves are expressed on a barrels of oil equivalent (“Boe”) basis where natural gas volumes are converted to Boe using a ratio of 6,000 cubic feet of natural gas to one barrel of oil. The Company engages independent, third party reserve evaluators to estimate the proved and probable oil and gas reserves. Lucero Energy Corp. 2024 Page 10
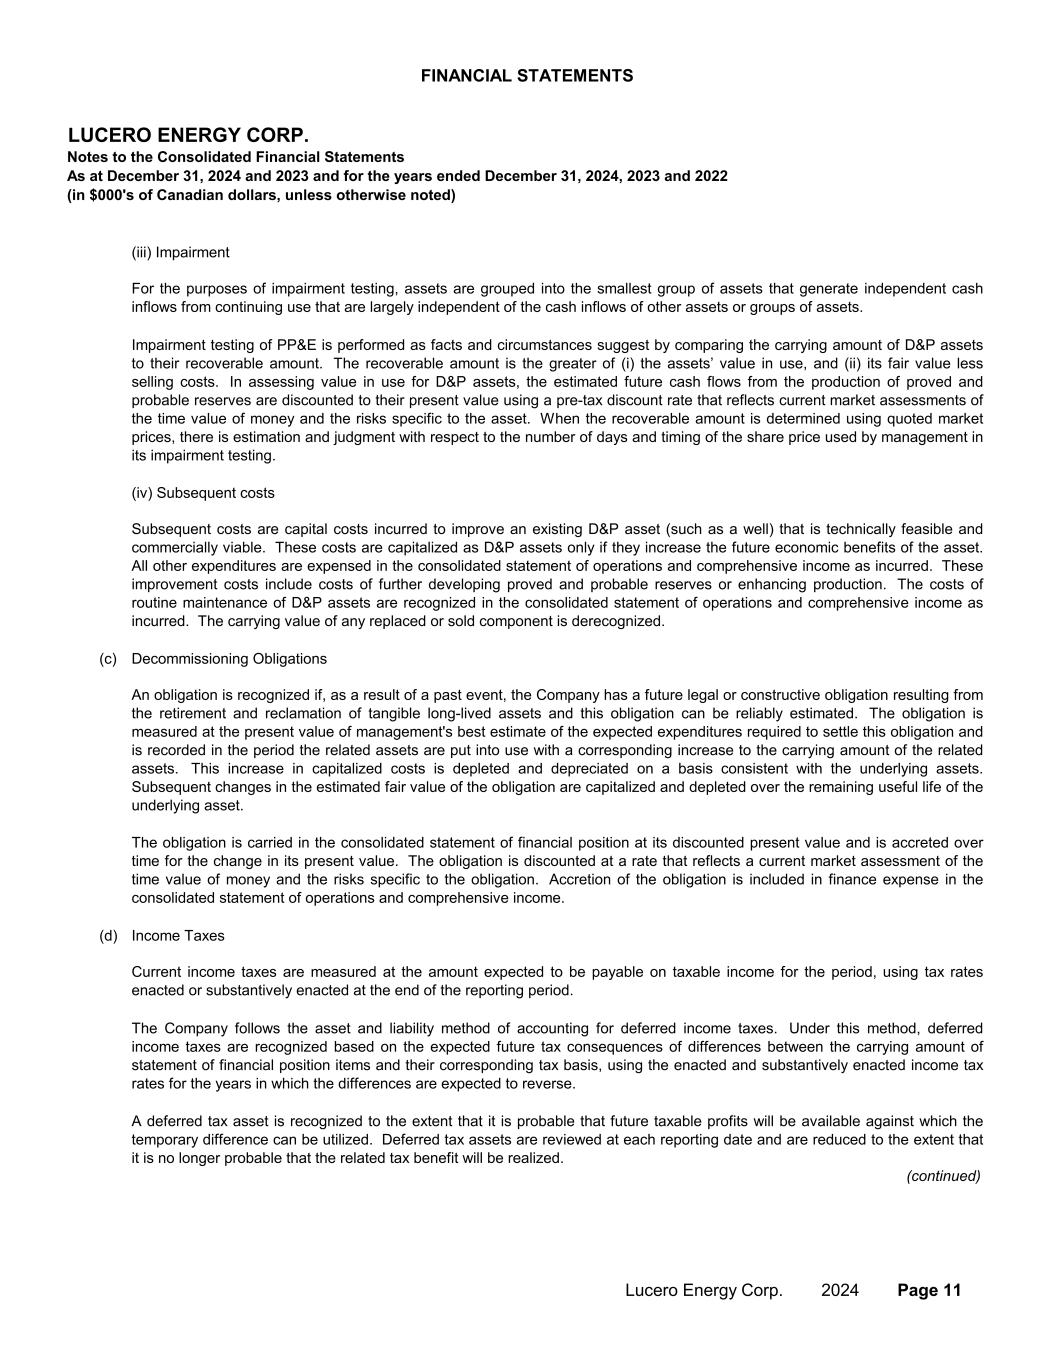
FINANCIAL STATEMENTS LUCERO ENERGY CORP. Notes to the Consolidated Financial Statements (in $000's of Canadian dollars, unless otherwise noted) As at December 31, 2024 and 2023 and for the years ended December 31, 2024, 2023 and 2022 (iii) Impairment (iv) Subsequent costs (c) Decommissioning Obligations (d) Income Taxes (continued) The Company follows the asset and liability method of accounting for deferred income taxes. Under this method, deferred income taxes are recognized based on the expected future tax consequences of differences between the carrying amount of statement of financial position items and their corresponding tax basis, using the enacted and substantively enacted income tax rates for the years in which the differences are expected to reverse. Subsequent costs are capital costs incurred to improve an existing D&P asset (such as a well) that is technically feasible and commercially viable. These costs are capitalized as D&P assets only if they increase the future economic benefits of the asset. All other expenditures are expensed in the consolidated statement of operations and comprehensive income as incurred. These improvement costs include costs of further developing proved and probable reserves or enhancing production. The costs of routine maintenance of D&P assets are recognized in the consolidated statement of operations and comprehensive income as incurred. The carrying value of any replaced or sold component is derecognized. An obligation is recognized if, as a result of a past event, the Company has a future legal or constructive obligation resulting from the retirement and reclamation of tangible long-lived assets and this obligation can be reliably estimated. The obligation is measured at the present value of management's best estimate of the expected expenditures required to settle this obligation and is recorded in the period the related assets are put into use with a corresponding increase to the carrying amount of the related assets. This increase in capitalized costs is depleted and depreciated on a basis consistent with the underlying assets. Subsequent changes in the estimated fair value of the obligation are capitalized and depleted over the remaining useful life of the underlying asset. The obligation is carried in the consolidated statement of financial position at its discounted present value and is accreted over time for the change in its present value. The obligation is discounted at a rate that reflects a current market assessment of the time value of money and the risks specific to the obligation. Accretion of the obligation is included in finance expense in the consolidated statement of operations and comprehensive income. Impairment testing of PP&E is performed as facts and circumstances suggest by comparing the carrying amount of D&P assets to their recoverable amount. The recoverable amount is the greater of (i) the assets’ value in use, and (ii) its fair value less selling costs. In assessing value in use for D&P assets, the estimated future cash flows from the production of proved and probable reserves are discounted to their present value using a pre-tax discount rate that reflects current market assessments of the time value of money and the risks specific to the asset. When the recoverable amount is determined using quoted market prices, there is estimation and judgment with respect to the number of days and timing of the share price used by management in its impairment testing. For the purposes of impairment testing, assets are grouped into the smallest group of assets that generate independent cash inflows from continuing use that are largely independent of the cash inflows of other assets or groups of assets. A deferred tax asset is recognized to the extent that it is probable that future taxable profits will be available against which the temporary difference can be utilized. Deferred tax assets are reviewed at each reporting date and are reduced to the extent that it is no longer probable that the related tax benefit will be realized. Current income taxes are measured at the amount expected to be payable on taxable income for the period, using tax rates enacted or substantively enacted at the end of the reporting period. Lucero Energy Corp. 2024 Page 11
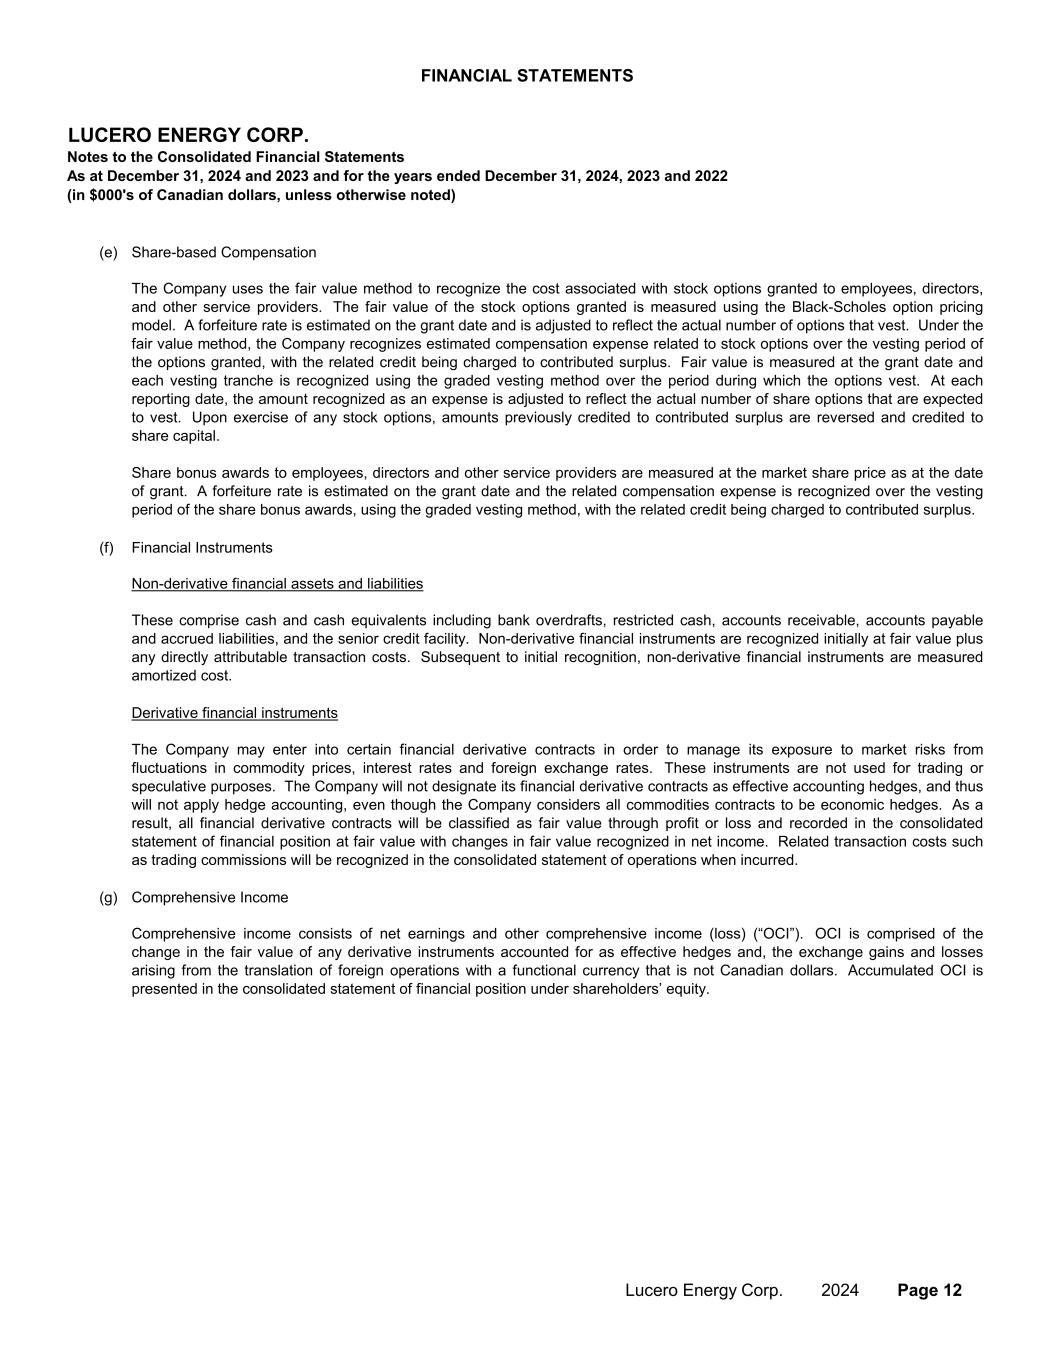
FINANCIAL STATEMENTS LUCERO ENERGY CORP. Notes to the Consolidated Financial Statements (in $000's of Canadian dollars, unless otherwise noted) As at December 31, 2024 and 2023 and for the years ended December 31, 2024, 2023 and 2022 (e) Share-based Compensation (f) Financial Instruments (g) Comprehensive Income These comprise cash and cash equivalents including bank overdrafts, restricted cash, accounts receivable, accounts payable and accrued liabilities, and the senior credit facility. Non-derivative financial instruments are recognized initially at fair value plus any directly attributable transaction costs. Subsequent to initial recognition, non-derivative financial instruments are measured amortized cost. The Company may enter into certain financial derivative contracts in order to manage its exposure to market risks from fluctuations in commodity prices, interest rates and foreign exchange rates. These instruments are not used for trading or speculative purposes. The Company will not designate its financial derivative contracts as effective accounting hedges, and thus will not apply hedge accounting, even though the Company considers all commodities contracts to be economic hedges. As a result, all financial derivative contracts will be classified as fair value through profit or loss and recorded in the consolidated statement of financial position at fair value with changes in fair value recognized in net income. Related transaction costs such as trading commissions will be recognized in the consolidated statement of operations when incurred. The Company uses the fair value method to recognize the cost associated with stock options granted to employees, directors, and other service providers. The fair value of the stock options granted is measured using the Black-Scholes option pricing model. A forfeiture rate is estimated on the grant date and is adjusted to reflect the actual number of options that vest. Under the fair value method, the Company recognizes estimated compensation expense related to stock options over the vesting period of the options granted, with the related credit being charged to contributed surplus. Fair value is measured at the grant date and each vesting tranche is recognized using the graded vesting method over the period during which the options vest. At each reporting date, the amount recognized as an expense is adjusted to reflect the actual number of share options that are expected to vest. Upon exercise of any stock options, amounts previously credited to contributed surplus are reversed and credited to share capital. Derivative financial instruments Non-derivative financial assets and liabilities Share bonus awards to employees, directors and other service providers are measured at the market share price as at the date of grant. A forfeiture rate is estimated on the grant date and the related compensation expense is recognized over the vesting period of the share bonus awards, using the graded vesting method, with the related credit being charged to contributed surplus. Comprehensive income consists of net earnings and other comprehensive income (loss) (“OCI”). OCI is comprised of the change in the fair value of any derivative instruments accounted for as effective hedges and, the exchange gains and losses arising from the translation of foreign operations with a functional currency that is not Canadian dollars. Accumulated OCI is presented in the consolidated statement of financial position under shareholders’ equity. Lucero Energy Corp. 2024 Page 12
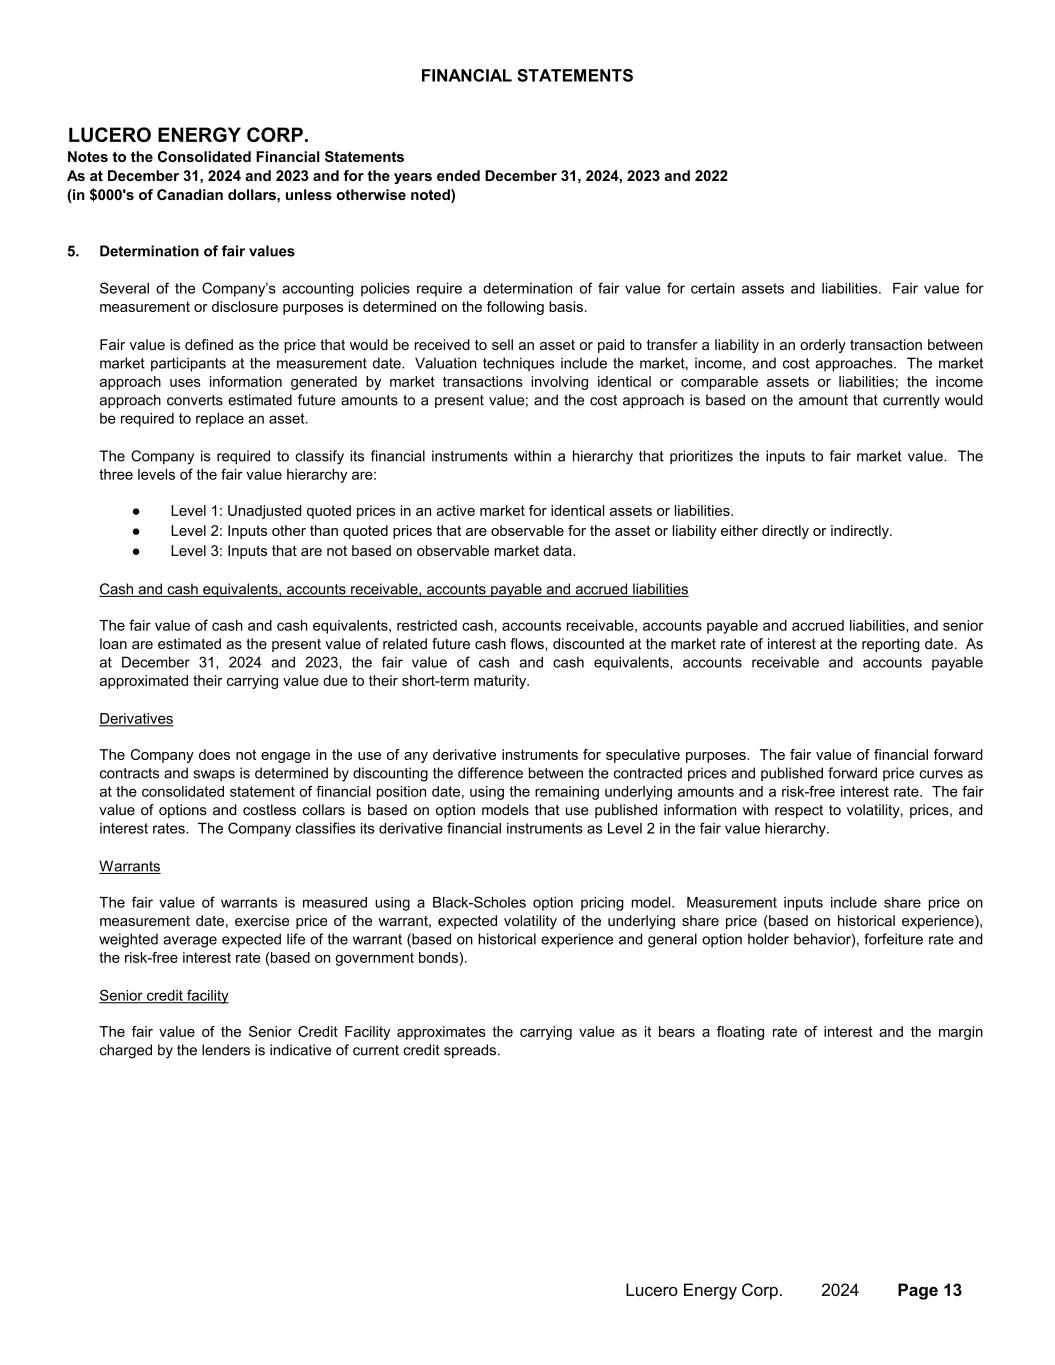
FINANCIAL STATEMENTS LUCERO ENERGY CORP. Notes to the Consolidated Financial Statements (in $000's of Canadian dollars, unless otherwise noted) As at December 31, 2024 and 2023 and for the years ended December 31, 2024, 2023 and 2022 5. Determination of fair values ● ● ● Derivatives Warrants Senior credit facility The fair value of cash and cash equivalents, restricted cash, accounts receivable, accounts payable and accrued liabilities, and senior loan are estimated as the present value of related future cash flows, discounted at the market rate of interest at the reporting date. As at December 31, 2024 and 2023, the fair value of cash and cash equivalents, accounts receivable and accounts payable approximated their carrying value due to their short-term maturity. The Company is required to classify its financial instruments within a hierarchy that prioritizes the inputs to fair market value. The three levels of the fair value hierarchy are: Fair value is defined as the price that would be received to sell an asset or paid to transfer a liability in an orderly transaction between market participants at the measurement date. Valuation techniques include the market, income, and cost approaches. The market approach uses information generated by market transactions involving identical or comparable assets or liabilities; the income approach converts estimated future amounts to a present value; and the cost approach is based on the amount that currently would be required to replace an asset. Level 1: Unadjusted quoted prices in an active market for identical assets or liabilities. Cash and cash equivalents, accounts receivable, accounts payable and accrued liabilities The fair value of the Senior Credit Facility approximates the carrying value as it bears a floating rate of interest and the margin charged by the lenders is indicative of current credit spreads. The Company does not engage in the use of any derivative instruments for speculative purposes. The fair value of financial forward contracts and swaps is determined by discounting the difference between the contracted prices and published forward price curves as at the consolidated statement of financial position date, using the remaining underlying amounts and a risk-free interest rate. The fair value of options and costless collars is based on option models that use published information with respect to volatility, prices, and interest rates. The Company classifies its derivative financial instruments as Level 2 in the fair value hierarchy. Level 3: Inputs that are not based on observable market data. Level 2: Inputs other than quoted prices that are observable for the asset or liability either directly or indirectly. Several of the Company’s accounting policies require a determination of fair value for certain assets and liabilities. Fair value for measurement or disclosure purposes is determined on the following basis. The fair value of warrants is measured using a Black-Scholes option pricing model. Measurement inputs include share price on measurement date, exercise price of the warrant, expected volatility of the underlying share price (based on historical experience), weighted average expected life of the warrant (based on historical experience and general option holder behavior), forfeiture rate and the risk-free interest rate (based on government bonds). Lucero Energy Corp. 2024 Page 13
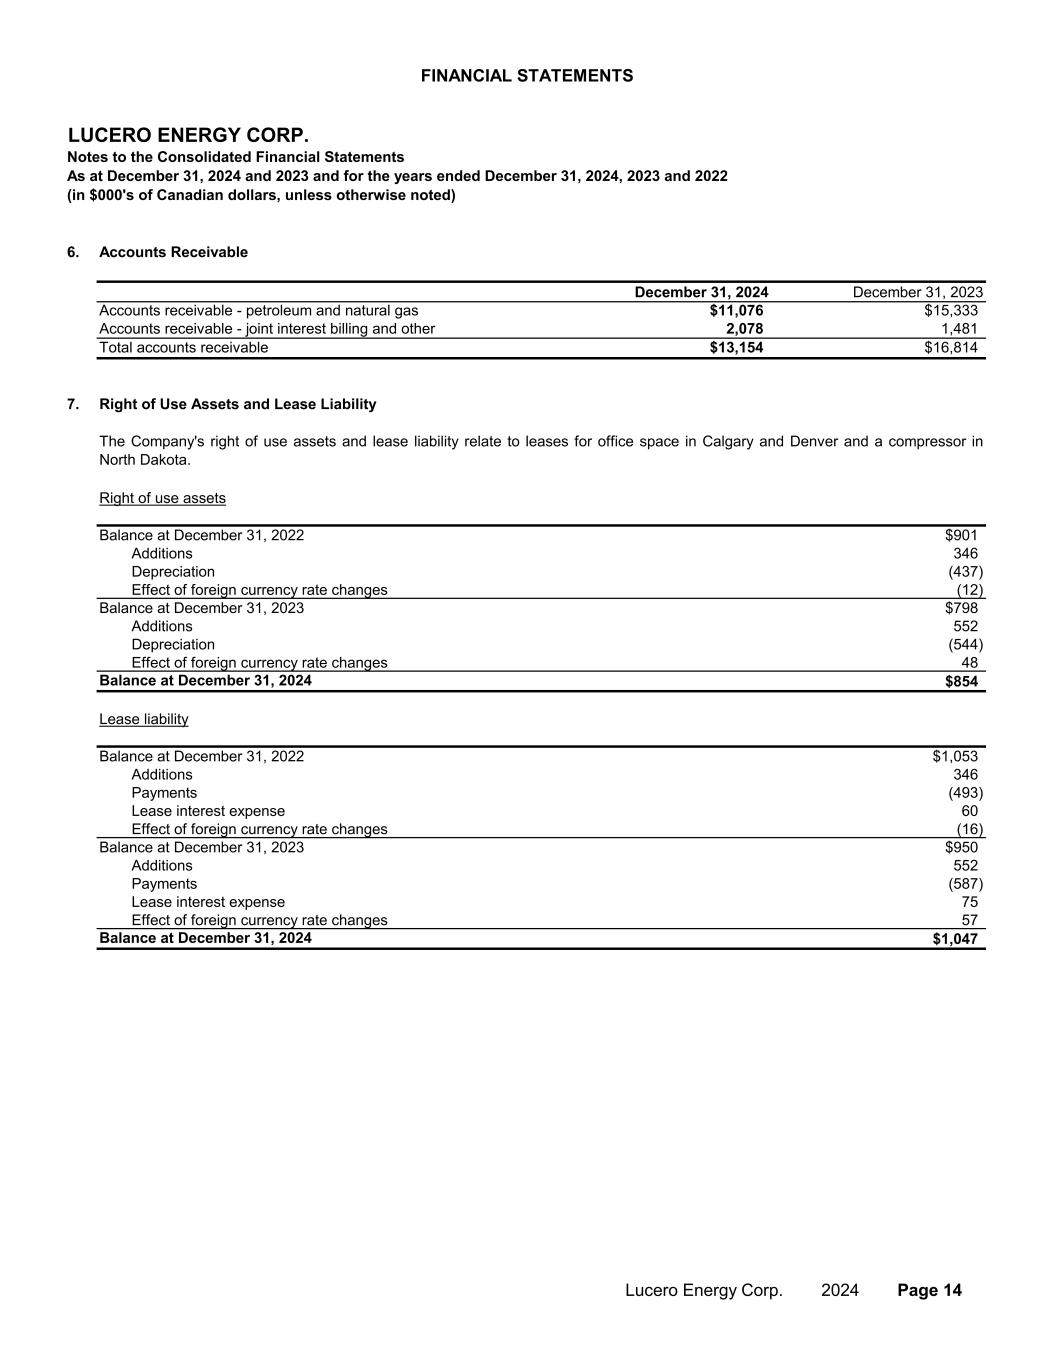
FINANCIAL STATEMENTS LUCERO ENERGY CORP. Notes to the Consolidated Financial Statements (in $000's of Canadian dollars, unless otherwise noted) As at December 31, 2024 and 2023 and for the years ended December 31, 2024, 2023 and 2022 6. Accounts Receivable Accounts receivable - petroleum and natural gas $11,076 $15,333 Accounts receivable - joint interest billing and other 2,078 1,481 Total accounts receivable $13,154 $16,814 7. Right of Use Assets and Lease Liability Right of use assets Balance at December 31, 2022 $901 Additions 346 Depreciation (437) Effect of foreign currency rate changes (12) Balance at December 31, 2023 $798 Additions 552 Depreciation (544) Effect of foreign currency rate changes 48 Balance at December 31, 2024 $854 Lease liability Balance at December 31, 2022 $1,053 Additions 346 Payments (493) Lease interest expense 60 Effect of foreign currency rate changes (16) Balance at December 31, 2023 $950 Additions 552 Payments (587) Lease interest expense 75 Effect of foreign currency rate changes 57 Balance at December 31, 2024 $1,047 The Company's right of use assets and lease liability relate to leases for office space in Calgary and Denver and a compressor in North Dakota. December 31, 2023December 31, 2024 Lucero Energy Corp. 2024 Page 14
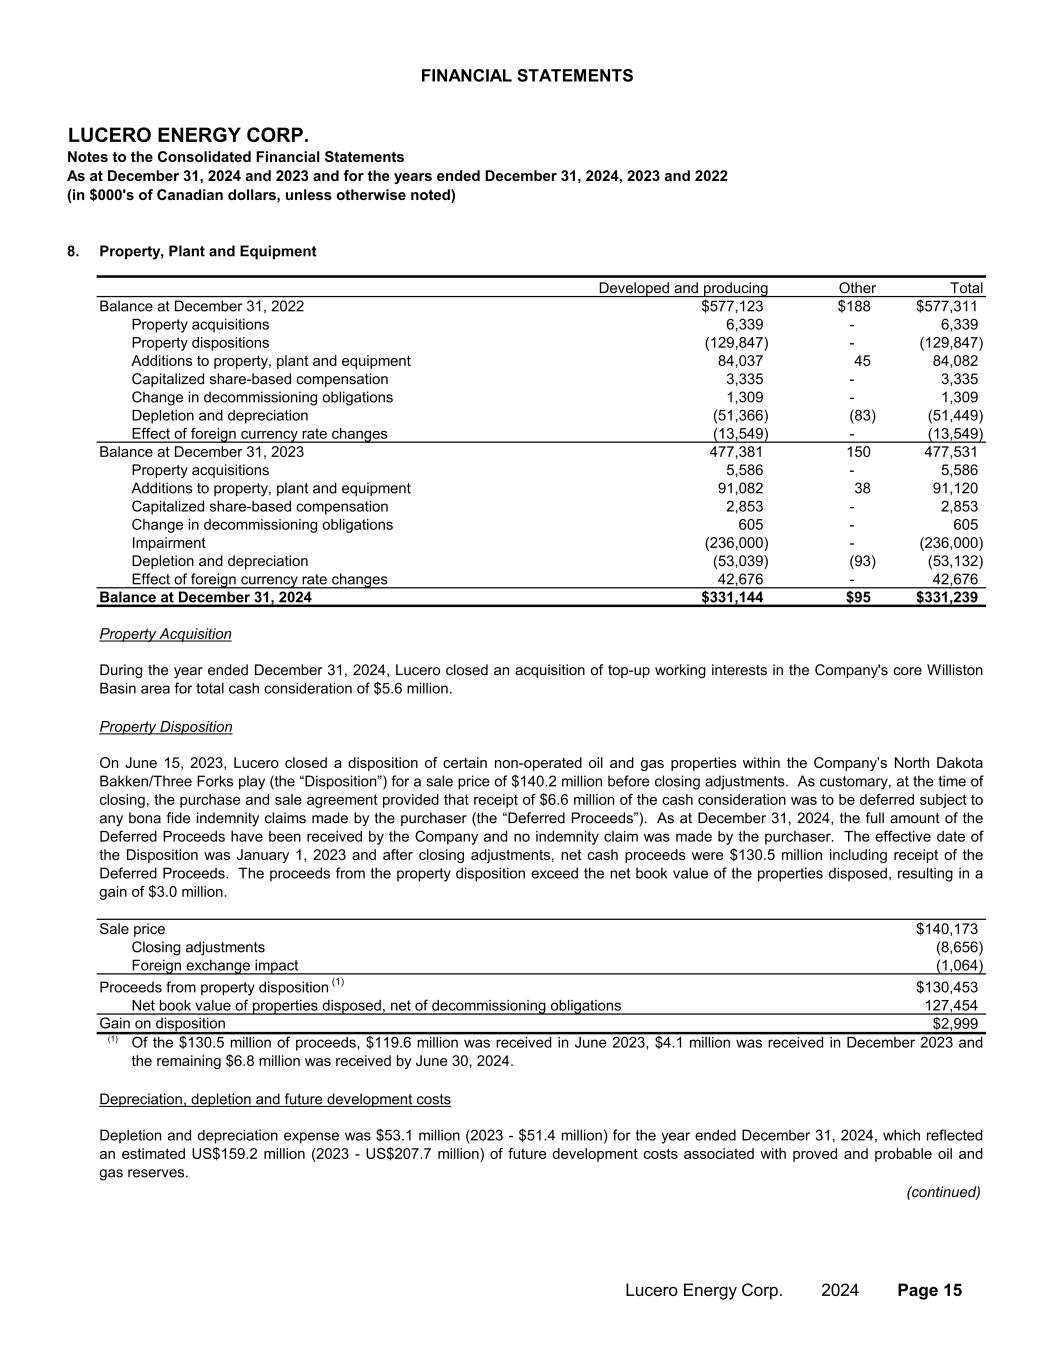
FINANCIAL STATEMENTS LUCERO ENERGY CORP. Notes to the Consolidated Financial Statements (in $000's of Canadian dollars, unless otherwise noted) As at December 31, 2024 and 2023 and for the years ended December 31, 2024, 2023 and 2022 8. Property, Plant and Equipment Developed and producing Other Total Balance at December 31, 2022 $577,123 $188 $577,311 Property acquisitions 6,339 - 6,339 Property dispositions (129,847) - (129,847) Additions to property, plant and equipment 84,037 45 84,082 Capitalized share-based compensation 3,335 - 3,335 Change in decommissioning obligations 1,309 - 1,309 Depletion and depreciation (51,366) (83) (51,449) Effect of foreign currency rate changes (13,549) - (13,549) Balance at December 31, 2023 477,381 150 477,531 Property acquisitions 5,586 - 5,586 Additions to property, plant and equipment 91,082 38 91,120 Capitalized share-based compensation 2,853 - 2,853 Change in decommissioning obligations 605 - 605 Impairment (236,000) - (236,000) Depletion and depreciation (53,039) (93) (53,132) Effect of foreign currency rate changes 42,676 - 42,676 Balance at December 31, 2024 $331,144 $95 $331,239 Property Acquisition Property Disposition Sale price $140,173 Closing adjustments (8,656) Foreign exchange impact (1,064) Proceeds from property disposition (1) $130,453 Net book value of properties disposed, net of decommissioning obligations 127,454 Gain on disposition $2,999 (1) Depreciation, depletion and future development costs (continued) Of the $130.5 million of proceeds, $119.6 million was received in June 2023, $4.1 million was received in December 2023 and the remaining $6.8 million was received by June 30, 2024. Depletion and depreciation expense was $53.1 million (2023 - $51.4 million) for the year ended December 31, 2024, which reflected an estimated US$159.2 million (2023 - US$207.7 million) of future development costs associated with proved and probable oil and gas reserves. During the year ended December 31, 2024, Lucero closed an acquisition of top-up working interests in the Company's core Williston Basin area for total cash consideration of $5.6 million. On June 15, 2023, Lucero closed a disposition of certain non-operated oil and gas properties within the Company’s North Dakota Bakken/Three Forks play (the “Disposition”) for a sale price of $140.2 million before closing adjustments. As customary, at the time of closing, the purchase and sale agreement provided that receipt of $6.6 million of the cash consideration was to be deferred subject to any bona fide indemnity claims made by the purchaser (the “Deferred Proceeds”). As at December 31, 2024, the full amount of the Deferred Proceeds have been received by the Company and no indemnity claim was made by the purchaser. The effective date of the Disposition was January 1, 2023 and after closing adjustments, net cash proceeds were $130.5 million including receipt of the Deferred Proceeds. The proceeds from the property disposition exceed the net book value of the properties disposed, resulting in a gain of $3.0 million. Lucero Energy Corp. 2024 Page 15
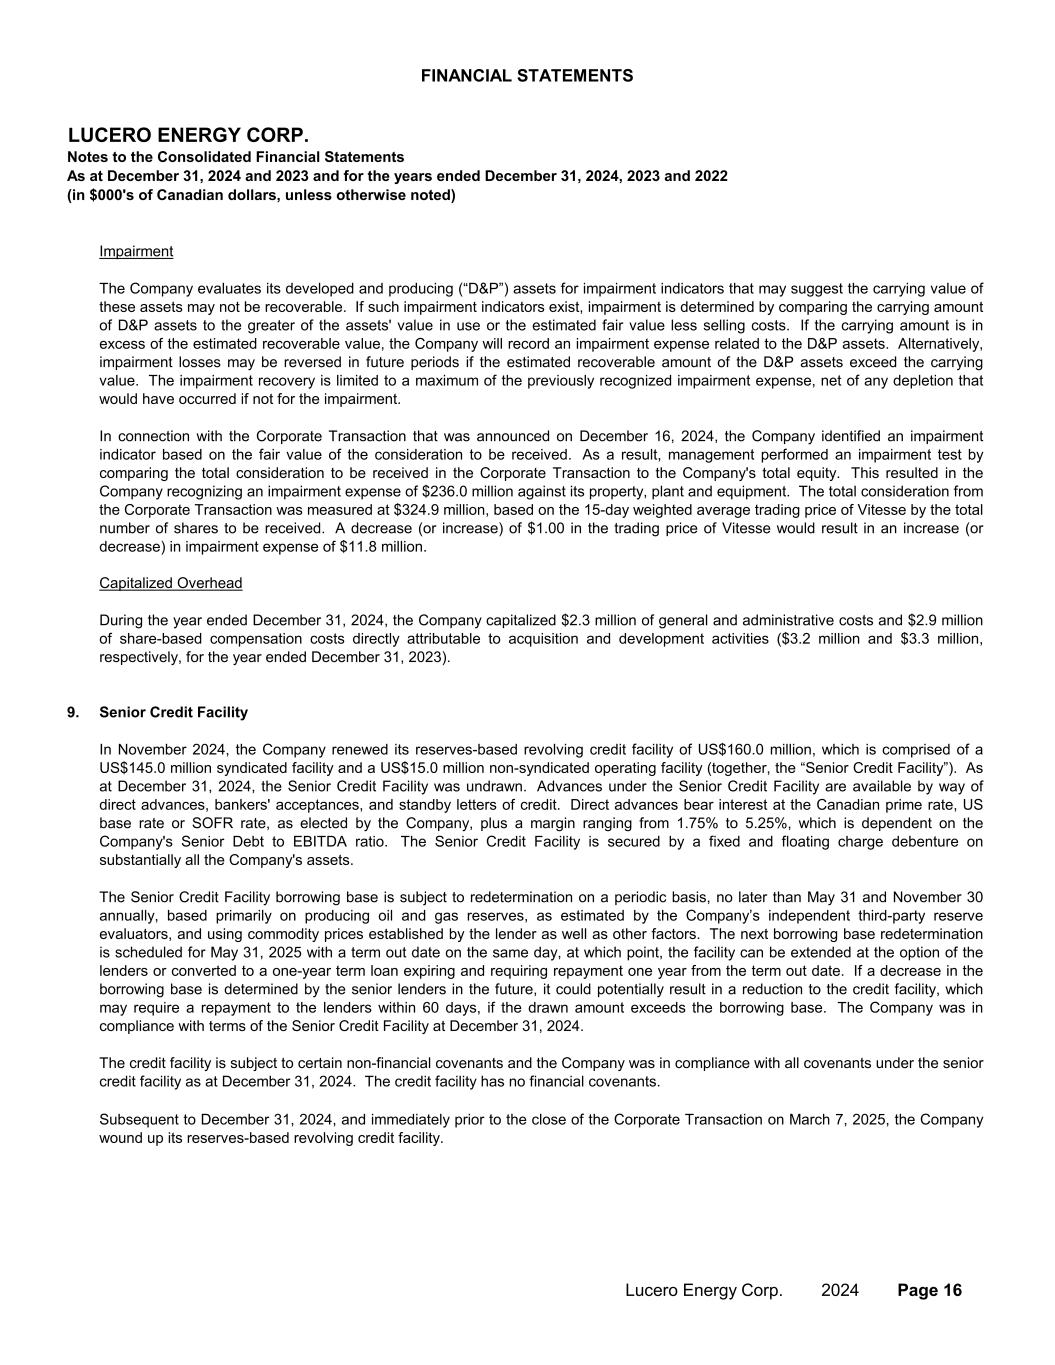
FINANCIAL STATEMENTS LUCERO ENERGY CORP. Notes to the Consolidated Financial Statements (in $000's of Canadian dollars, unless otherwise noted) As at December 31, 2024 and 2023 and for the years ended December 31, 2024, 2023 and 2022 Impairment Capitalized Overhead 9. Senior Credit Facility During the year ended December 31, 2024, the Company capitalized $2.3 million of general and administrative costs and $2.9 million of share-based compensation costs directly attributable to acquisition and development activities ($3.2 million and $3.3 million, respectively, for the year ended December 31, 2023). The Company evaluates its developed and producing (“D&P”) assets for impairment indicators that may suggest the carrying value of these assets may not be recoverable. If such impairment indicators exist, impairment is determined by comparing the carrying amount of D&P assets to the greater of the assets' value in use or the estimated fair value less selling costs. If the carrying amount is in excess of the estimated recoverable value, the Company will record an impairment expense related to the D&P assets. Alternatively, impairment losses may be reversed in future periods if the estimated recoverable amount of the D&P assets exceed the carrying value. The impairment recovery is limited to a maximum of the previously recognized impairment expense, net of any depletion that would have occurred if not for the impairment. Subsequent to December 31, 2024, and immediately prior to the close of the Corporate Transaction on March 7, 2025, the Company wound up its reserves-based revolving credit facility. In November 2024, the Company renewed its reserves-based revolving credit facility of US$160.0 million, which is comprised of a US$145.0 million syndicated facility and a US$15.0 million non-syndicated operating facility (together, the “Senior Credit Facility”). As at December 31, 2024, the Senior Credit Facility was undrawn. Advances under the Senior Credit Facility are available by way of direct advances, bankers' acceptances, and standby letters of credit. Direct advances bear interest at the Canadian prime rate, US base rate or SOFR rate, as elected by the Company, plus a margin ranging from 1.75% to 5.25%, which is dependent on the Company's Senior Debt to EBITDA ratio. The Senior Credit Facility is secured by a fixed and floating charge debenture on substantially all the Company's assets. The Senior Credit Facility borrowing base is subject to redetermination on a periodic basis, no later than May 31 and November 30 annually, based primarily on producing oil and gas reserves, as estimated by the Company’s independent third-party reserve evaluators, and using commodity prices established by the lender as well as other factors. The next borrowing base redetermination is scheduled for May 31, 2025 with a term out date on the same day, at which point, the facility can be extended at the option of the lenders or converted to a one-year term loan expiring and requiring repayment one year from the term out date. If a decrease in the borrowing base is determined by the senior lenders in the future, it could potentially result in a reduction to the credit facility, which may require a repayment to the lenders within 60 days, if the drawn amount exceeds the borrowing base. The Company was in compliance with terms of the Senior Credit Facility at December 31, 2024. In connection with the Corporate Transaction that was announced on December 16, 2024, the Company identified an impairment indicator based on the fair value of the consideration to be received. As a result, management performed an impairment test by comparing the total consideration to be received in the Corporate Transaction to the Company's total equity. This resulted in the Company recognizing an impairment expense of $236.0 million against its property, plant and equipment. The total consideration from the Corporate Transaction was measured at $324.9 million, based on the 15-day weighted average trading price of Vitesse by the total number of shares to be received. A decrease (or increase) of $1.00 in the trading price of Vitesse would result in an increase (or decrease) in impairment expense of $11.8 million. The credit facility is subject to certain non-financial covenants and the Company was in compliance with all covenants under the senior credit facility as at December 31, 2024. The credit facility has no financial covenants. Lucero Energy Corp. 2024 Page 16

FINANCIAL STATEMENTS LUCERO ENERGY CORP. Notes to the Consolidated Financial Statements (in $000's of Canadian dollars, unless otherwise noted) As at December 31, 2024 and 2023 and for the years ended December 31, 2024, 2023 and 2022 10. Decommissioning Obligations Balance, beginning of year $4,623 $5,993 Obligations incurred 378 549 Obligations acquired - 90 Obligations disposed - (2,393) Obligations settled - cash (1,167) (304) Change in estimated future cash flows 227 670 Accretion 172 169 Effect of foreign currency rate changes 395 (151) Balance, end of year $4,628 $4,623 11. Share Capital ● ● ● (continued) Lucero's decommissioning obligations consist of remediation obligations resulting from the Company's ownership interests in petroleum and natural gas assets. The total obligation is estimated based on the Company's net working interest in wells and related facilities, estimated costs to return these sites to their original condition, costs to plug and abandon wells and the estimated timing of the costs to be incurred in future years. one-third of the warrants may be exercised after the Company's Trading Price exceeds $0.95. one-third of the warrants may be exercised after the Company's trading price (the "Trading Price") exceeds $0.67, The Company has estimated the net present value of its total decommissioning provision to be $4.6 million at December 31, 2024 ($4.6 million at December 31, 2023) based on a total undiscounted and uninflated liability of $8.4 million ($7.7 million at December 31, 2023). Management estimates that these payments are expected to be made over the next 50 years based in part on estimates prepared by independent third-party reserve evaluators. As at December 31, 2024, a risk-free interest rate of 4.8% (4.0% at December 31, 2023) and an inflation rate of 2.3% (2.2% at December 31, 2023) were used to calculate the present value of the decommissioning obligation. Warrants At December 31, 2024, 15.8 million warrants had vested (15.8 million at December 31, 2023), which represents the first two thirds of the total warrants issued. In the year ended December 31, 2024, 1.8 million warrants had been exercised on a cashless basis, and 0.9 million had been forfeited. At the election of the warrant holder, warrants may be exercised on a cashless basis, which converts the difference between the exercise price and the prevailing Trading Price, into common shares, with no cash proceeds received by the Company. All remaining warrants issued or exercisable will expire on February 1, 2027. Subsequent to December 31, 2024, and immediately prior to the close of the Corporate Transaction on March 7, 2025, all warrants issued or excercisable, were cancelled. As part of private placements closed in February 2022, 23,750,000 warrants were issued, each entitling the holder to acquire one common share at a price of $0.475, subject to the following conditions: As at December 31, 2024 As at December 31, 2023 one-third of the warrants may be exercised after the Company's Trading Price exceeds $0.83, and The Trading Price is defined as the 20-day weighted average trading price. Lucero Energy Corp. 2024 Page 17
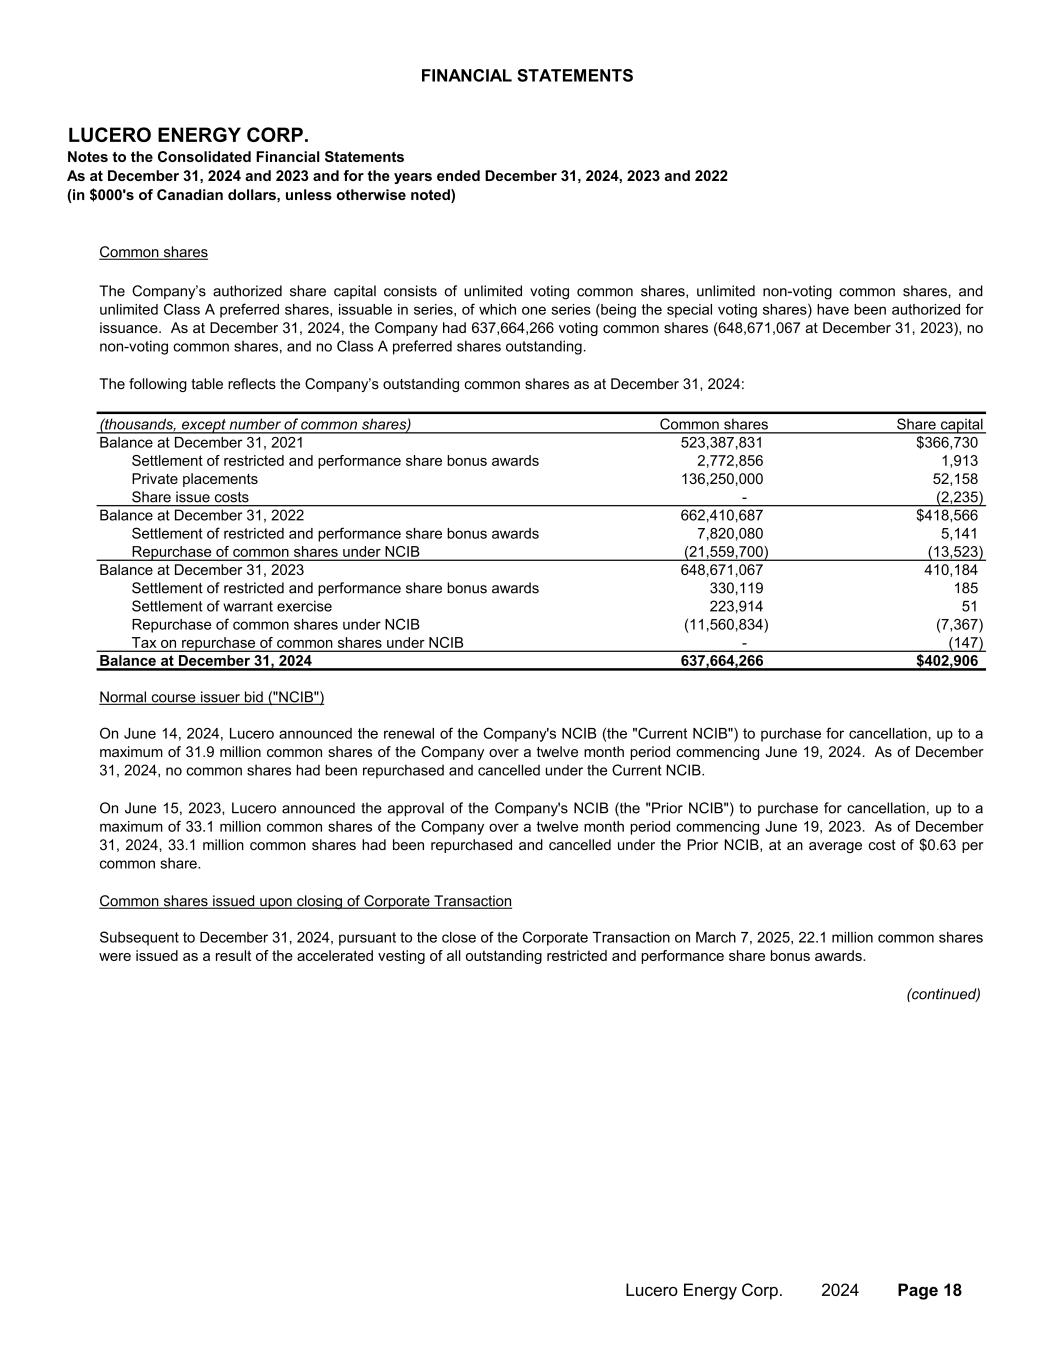
FINANCIAL STATEMENTS LUCERO ENERGY CORP. Notes to the Consolidated Financial Statements (in $000's of Canadian dollars, unless otherwise noted) As at December 31, 2024 and 2023 and for the years ended December 31, 2024, 2023 and 2022 (thousands, except number of common shares) Common shares Share capital Balance at December 31, 2021 523,387,831 $366,730 Settlement of restricted and performance share bonus awards 2,772,856 1,913 Private placements 136,250,000 52,158 Share issue costs - (2,235) Balance at December 31, 2022 662,410,687 $418,566 Settlement of restricted and performance share bonus awards 7,820,080 5,141 Repurchase of common shares under NCIB (21,559,700) (13,523) Balance at December 31, 2023 648,671,067 410,184 Settlement of restricted and performance share bonus awards 330,119 185 Settlement of warrant exercise 223,914 51 Repurchase of common shares under NCIB (11,560,834) (7,367) Tax on repurchase of common shares under NCIB - (147) Balance at December 31, 2024 637,664,266 $402,906 (continued) On June 15, 2023, Lucero announced the approval of the Company's NCIB (the "Prior NCIB") to purchase for cancellation, up to a maximum of 33.1 million common shares of the Company over a twelve month period commencing June 19, 2023. As of December 31, 2024, 33.1 million common shares had been repurchased and cancelled under the Prior NCIB, at an average cost of $0.63 per common share. The Company’s authorized share capital consists of unlimited voting common shares, unlimited non-voting common shares, and unlimited Class A preferred shares, issuable in series, of which one series (being the special voting shares) have been authorized for issuance. As at December 31, 2024, the Company had 637,664,266 voting common shares (648,671,067 at December 31, 2023), no non-voting common shares, and no Class A preferred shares outstanding. Common shares The following table reflects the Company’s outstanding common shares as at December 31, 2024: Normal course issuer bid ("NCIB") On June 14, 2024, Lucero announced the renewal of the Company's NCIB (the "Current NCIB") to purchase for cancellation, up to a maximum of 31.9 million common shares of the Company over a twelve month period commencing June 19, 2024. As of December 31, 2024, no common shares had been repurchased and cancelled under the Current NCIB. Common shares issued upon closing of Corporate Transaction Subsequent to December 31, 2024, pursuant to the close of the Corporate Transaction on March 7, 2025, 22.1 million common shares were issued as a result of the accelerated vesting of all outstanding restricted and performance share bonus awards. Lucero Energy Corp. 2024 Page 18
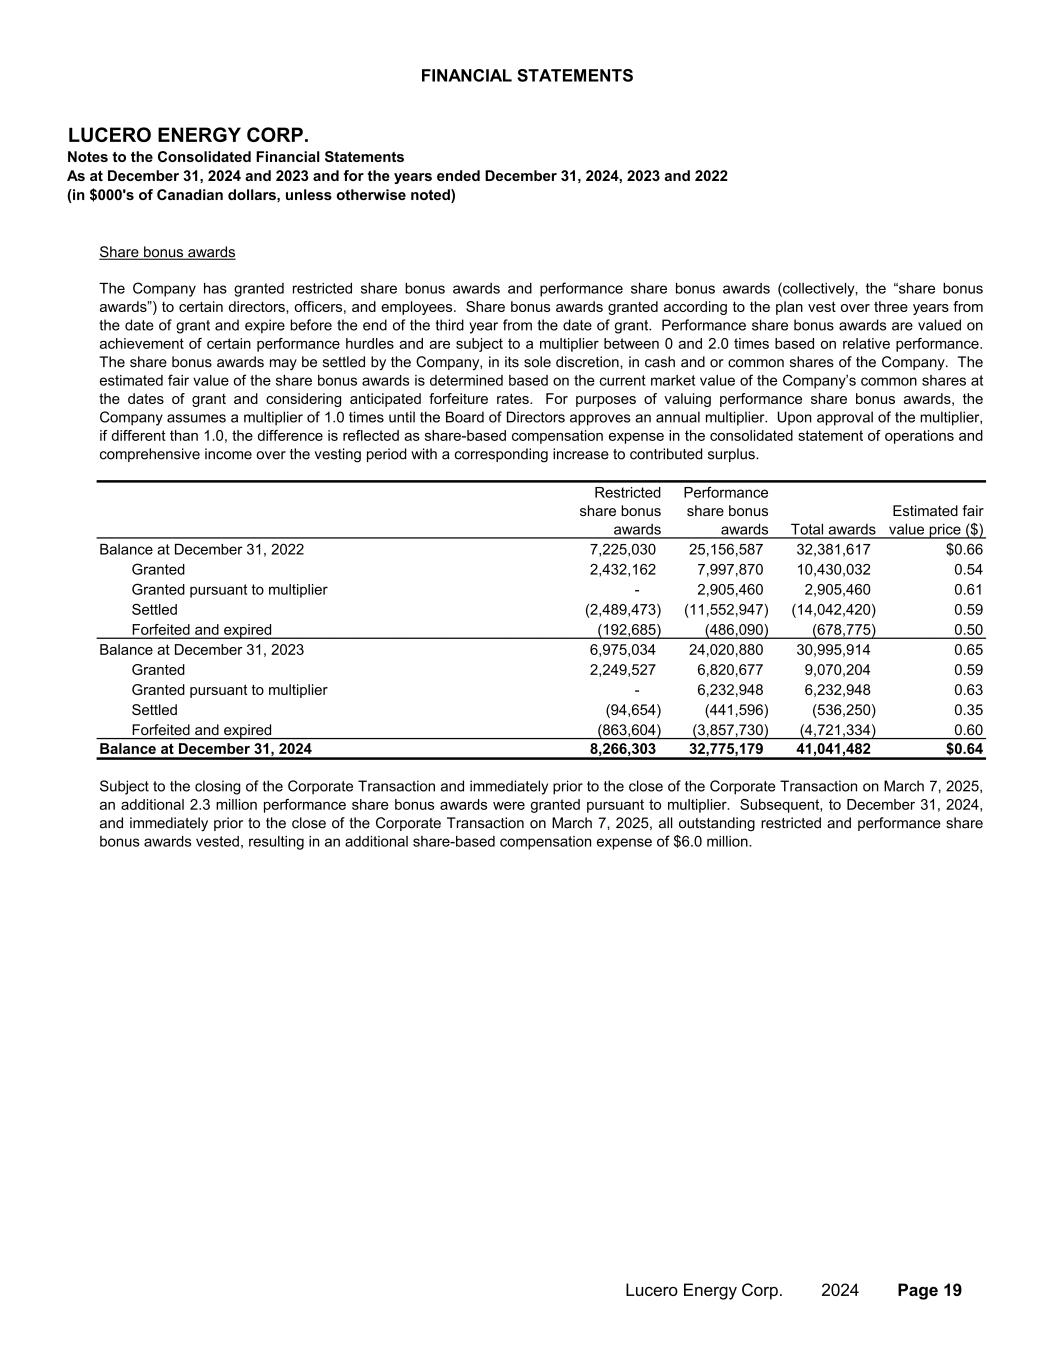
FINANCIAL STATEMENTS LUCERO ENERGY CORP. Notes to the Consolidated Financial Statements (in $000's of Canadian dollars, unless otherwise noted) As at December 31, 2024 and 2023 and for the years ended December 31, 2024, 2023 and 2022 Restricted share bonus awards Performance share bonus awards Total awards Estimated fair value price ($) Balance at December 31, 2022 7,225,030 25,156,587 32,381,617 $0.66 Granted 2,432,162 7,997,870 10,430,032 0.54 Granted pursuant to multiplier - 2,905,460 2,905,460 0.61 Settled (2,489,473) (11,552,947) (14,042,420) 0.59 Forfeited and expired (192,685) (486,090) (678,775) 0.50 Balance at December 31, 2023 6,975,034 24,020,880 30,995,914 0.65 Granted 2,249,527 6,820,677 9,070,204 0.59 Granted pursuant to multiplier - 6,232,948 6,232,948 0.63 Settled (94,654) (441,596) (536,250) 0.35 Forfeited and expired (863,604) (3,857,730) (4,721,334) 0.60 Balance at December 31, 2024 8,266,303 32,775,179 41,041,482 $0.64 Share bonus awards The Company has granted restricted share bonus awards and performance share bonus awards (collectively, the “share bonus awards”) to certain directors, officers, and employees. Share bonus awards granted according to the plan vest over three years from the date of grant and expire before the end of the third year from the date of grant. Performance share bonus awards are valued on achievement of certain performance hurdles and are subject to a multiplier between 0 and 2.0 times based on relative performance. The share bonus awards may be settled by the Company, in its sole discretion, in cash and or common shares of the Company. The estimated fair value of the share bonus awards is determined based on the current market value of the Company’s common shares at the dates of grant and considering anticipated forfeiture rates. For purposes of valuing performance share bonus awards, the Company assumes a multiplier of 1.0 times until the Board of Directors approves an annual multiplier. Upon approval of the multiplier, if different than 1.0, the difference is reflected as share-based compensation expense in the consolidated statement of operations and comprehensive income over the vesting period with a corresponding increase to contributed surplus. Subject to the closing of the Corporate Transaction and immediately prior to the close of the Corporate Transaction on March 7, 2025, an additional 2.3 million performance share bonus awards were granted pursuant to multiplier. Subsequent, to December 31, 2024, and immediately prior to the close of the Corporate Transaction on March 7, 2025, all outstanding restricted and performance share bonus awards vested, resulting in an additional share-based compensation expense of $6.0 million. Lucero Energy Corp. 2024 Page 19
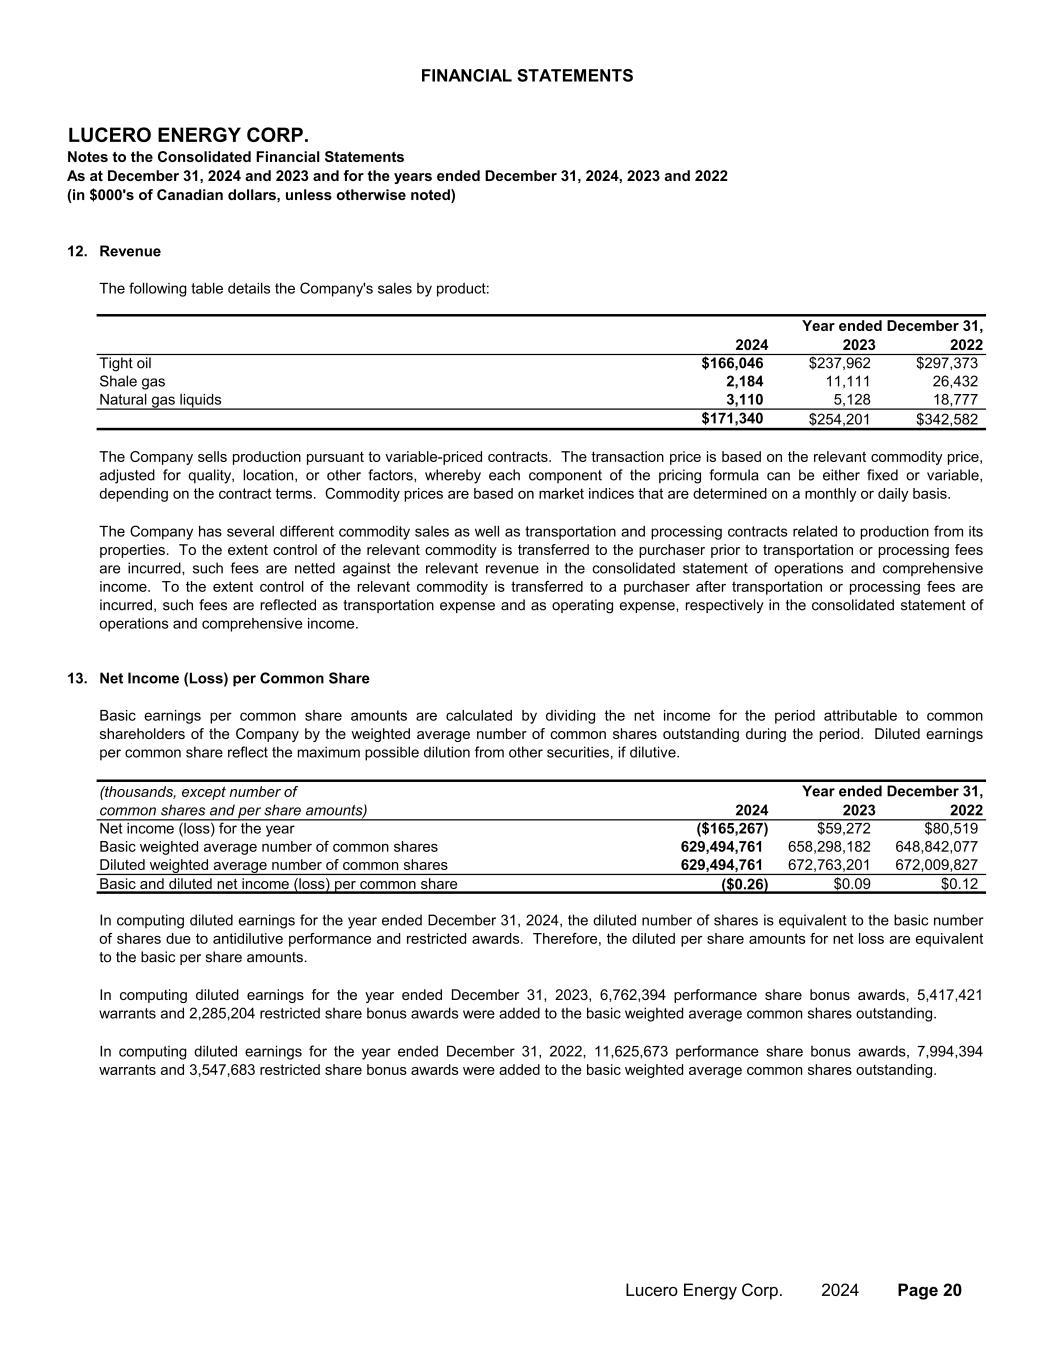
FINANCIAL STATEMENTS LUCERO ENERGY CORP. Notes to the Consolidated Financial Statements (in $000's of Canadian dollars, unless otherwise noted) As at December 31, 2024 and 2023 and for the years ended December 31, 2024, 2023 and 2022 12. Revenue 2023 2024 2023 2022 Tight oil $55,554 $166,046 $237,962 $297,373 Shale gas 1,660 2,184 11,111 26,432 Natural gas liquids 1,466 3,110 5,128 18,777 $58,680 $171,340 $254,201 $342,582 13. Net Income (Loss) per Common Share 2023 2024 2023 2022 Net income (loss) for the year $16,882 ($165,267) $59,272 $80,519 Basic weighted average number of common shares 649,983,980 629,494,761 658,298,182 648,842,077 Diluted weighted average number of common shares 674,271,401 629,494,761 672,763,201 672,009,827 Basic and diluted net income (loss) per common share $0.03 ($0.26) $0.09 $0.12 Year ended December 31,(thousands, except number of common shares and per share amounts) In computing diluted earnings for the year ended December 31, 2023, 6,762,394 performance share bonus awards, 5,417,421 warrants and 2,285,204 restricted share bonus awards were added to the basic weighted average common shares outstanding. Three months Basic earnings per common share amounts are calculated by dividing the net income for the period attributable to common shareholders of the Company by the weighted average number of common shares outstanding during the period. Diluted earnings per common share reflect the maximum possible dilution from other securities, if dilutive. Year ended December 31, The following table details the Company's sales by product: The Company sells production pursuant to variable-priced contracts. The transaction price is based on the relevant commodity price, adjusted for quality, location, or other factors, whereby each component of the pricing formula can be either fixed or variable, depending on the contract terms. Commodity prices are based on market indices that are determined on a monthly or daily basis. Three months In computing diluted earnings for the year ended December 31, 2022, 11,625,673 performance share bonus awards, 7,994,394 warrants and 3,547,683 restricted share bonus awards were added to the basic weighted average common shares outstanding. The Company has several different commodity sales as well as transportation and processing contracts related to production from its properties. To the extent control of the relevant commodity is transferred to the purchaser prior to transportation or processing fees are incurred, such fees are netted against the relevant revenue in the consolidated statement of operations and comprehensive income. To the extent control of the relevant commodity is transferred to a purchaser after transportation or processing fees are incurred, such fees are reflected as transportation expense and as operating expense, respectively in the consolidated statement of operations and comprehensive income. In computing diluted earnings for the year ended December 31, 2024, the diluted number of shares is equivalent to the basic number of shares due to antidilutive performance and restricted awards. Therefore, the diluted per share amounts for net loss are equivalent to the basic per share amounts. Lucero Energy Corp. 2024 Page 20
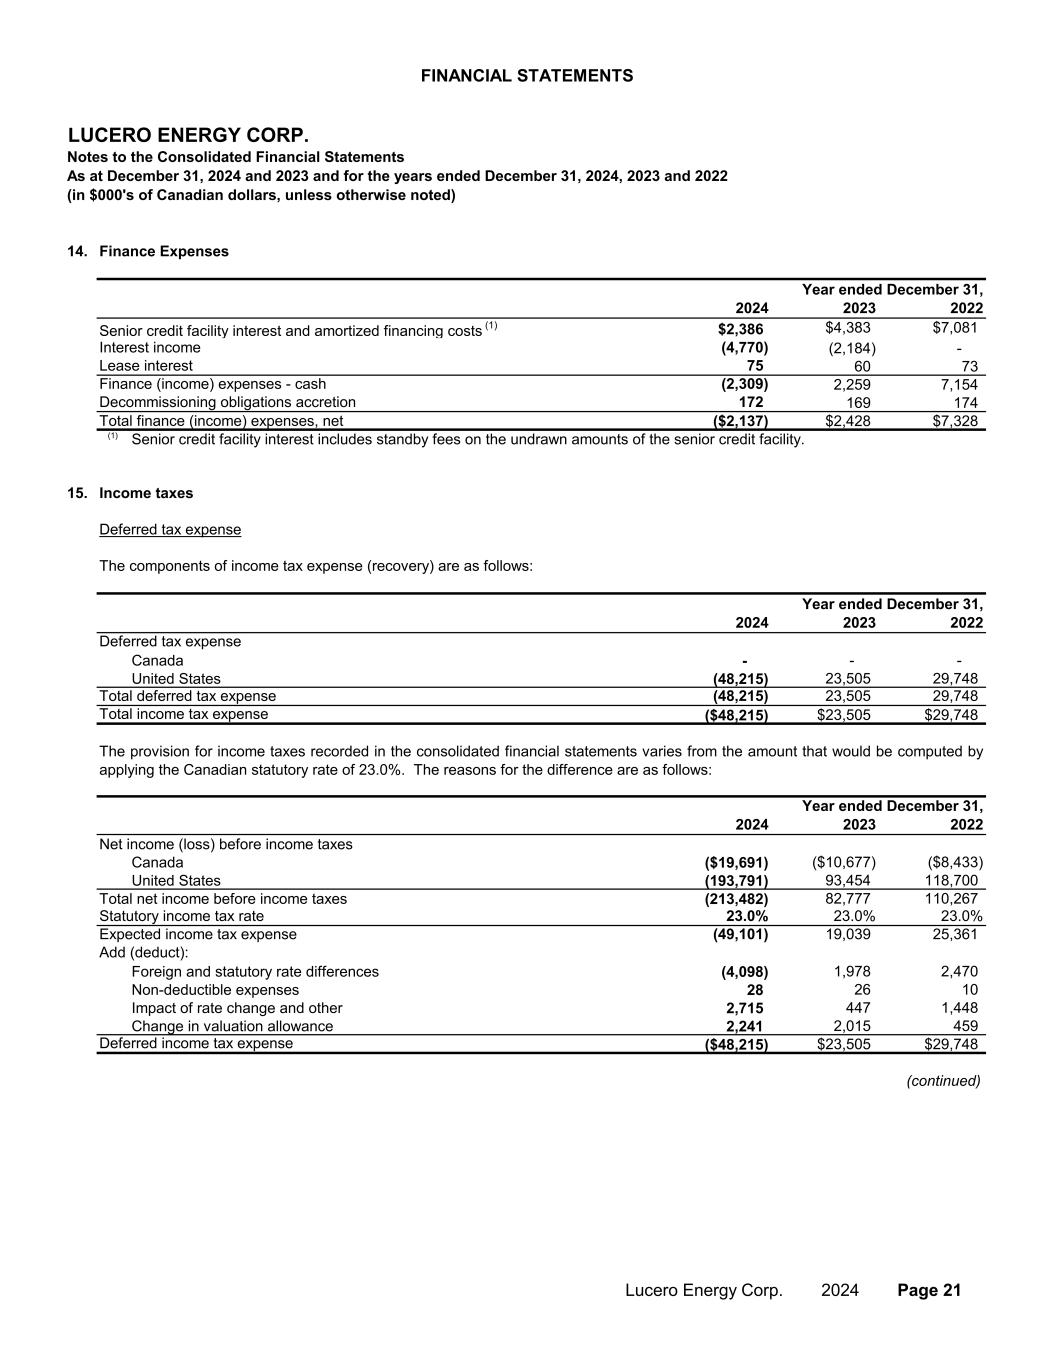
FINANCIAL STATEMENTS LUCERO ENERGY CORP. Notes to the Consolidated Financial Statements (in $000's of Canadian dollars, unless otherwise noted) As at December 31, 2024 and 2023 and for the years ended December 31, 2024, 2023 and 2022 14. Finance Expenses 2023 2024 2023 2022 Senior credit facility interest and amortized financing costs (1) $672 $2,386 $4,383 $7,081 Interest income (1,113) (4,770) (2,184) - Lease interest 17 75 60 73 Finance (income) expenses - cash (424) (2,309) 2,259 7,154 Decommissioning obligations accretion 39 172 169 174 Total finance (income) expenses, net ($385) ($2,137) $2,428 $7,328 (1) 15. Income taxes Deferred tax expense 2024 2023 2022 Deferred tax expense Canada - - - United States (48,215) 23,505 29,748 Total deferred tax expense (48,215) 23,505 29,748 Total income tax expense ($48,215) $23,505 $29,748 2024 2023 2022 Net income (loss) before income taxes Canada ($19,691) ($10,677) ($8,433) United States (193,791) 93,454 118,700 Total net income before income taxes (213,482) 82,777 110,267 Statutory income tax rate 23.0% 23.0% 23.0% Expected income tax expense (49,101) 19,039 25,361 Add (deduct): Foreign and statutory rate differences (4,098) 1,978 2,470 Non-deductible expenses 28 26 10 Impact of rate change and other 2,715 447 1,448 Change in valuation allowance 2,241 2,015 459 Deferred income tax expense ($48,215) $23,505 $29,748 (continued) Senior credit facility interest includes standby fees on the undrawn amounts of the senior credit facility. Year ended December 31, The components of income tax expense (recovery) are as follows: Year ended December 31, The provision for income taxes recorded in the consolidated financial statements varies from the amount that would be computed by applying the Canadian statutory rate of 23.0%. The reasons for the difference are as follows: Three months Year ended December 31, Lucero Energy Corp. 2024 Page 21
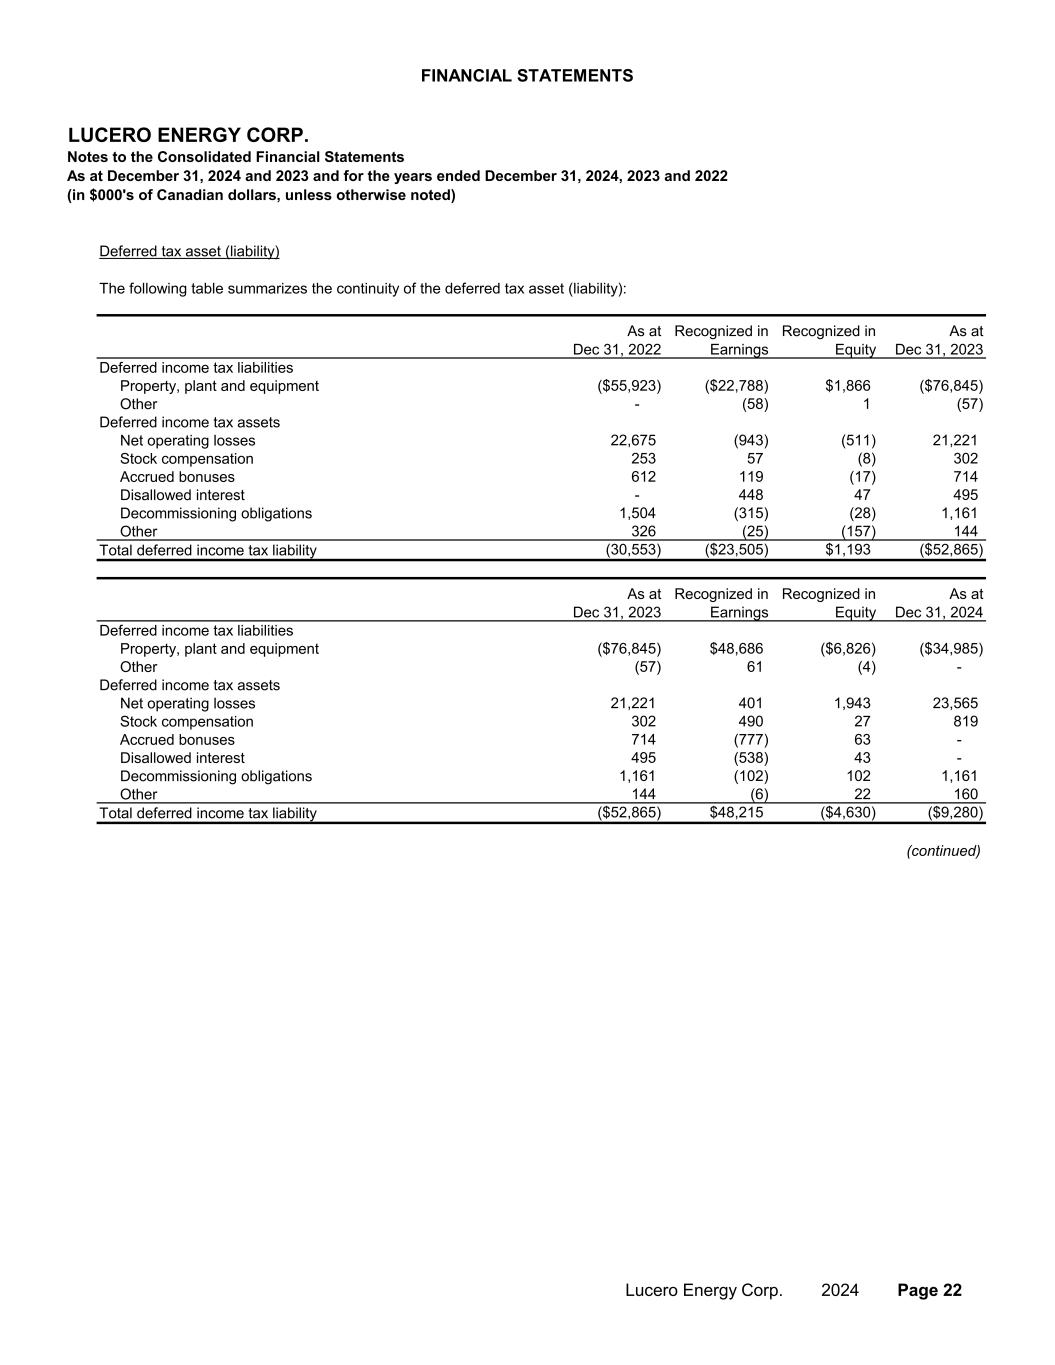
FINANCIAL STATEMENTS LUCERO ENERGY CORP. Notes to the Consolidated Financial Statements (in $000's of Canadian dollars, unless otherwise noted) As at December 31, 2024 and 2023 and for the years ended December 31, 2024, 2023 and 2022 Deferred tax asset (liability) As at Dec 31, 2022 Recognized in Earnings Recognized in Equity As at Dec 31, 2023 Deferred income tax liabilities Property, plant and equipment ($55,923) ($22,788) $1,866 ($76,845) Other - (58) 1 (57) Deferred income tax assets Net operating losses 22,675 (943) (511) 21,221 Stock compensation 253 57 (8) 302 Accrued bonuses 612 119 (17) 714 Disallowed interest - 448 47 495 Decommissioning obligations 1,504 (315) (28) 1,161 Other 326 (25) (157) 144 Total deferred income tax liability (30,553) ($23,505) $1,193 ($52,865) As at Dec 31, 2023 Recognized in Earnings Recognized in Equity As at Dec 31, 2024 Deferred income tax liabilities Property, plant and equipment ($76,845) $48,686 ($6,826) ($34,985) Other (57) 61 (4) - Deferred income tax assets Net operating losses 21,221 401 1,943 23,565 Stock compensation 302 490 27 819 Accrued bonuses 714 (777) 63 - Disallowed interest 495 (538) 43 - Decommissioning obligations 1,161 (102) 102 1,161 Other 144 (6) 22 160 Total deferred income tax liability ($52,865) $48,215 ($4,630) ($9,280) (continued) The following table summarizes the continuity of the deferred tax asset (liability): Lucero Energy Corp. 2024 Page 22
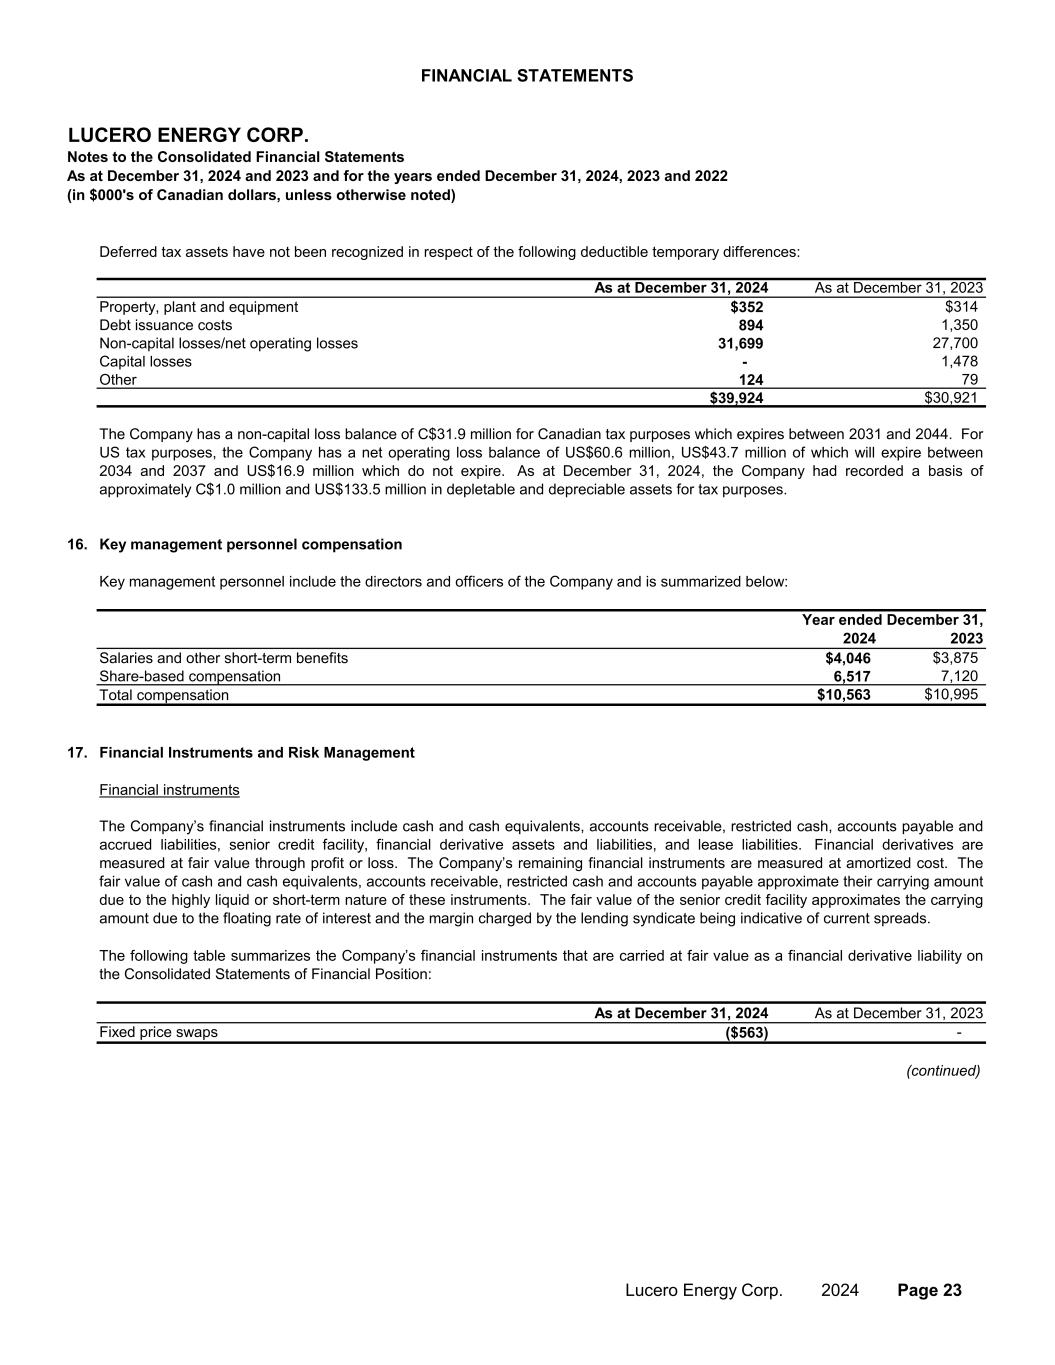
FINANCIAL STATEMENTS LUCERO ENERGY CORP. Notes to the Consolidated Financial Statements (in $000's of Canadian dollars, unless otherwise noted) As at December 31, 2024 and 2023 and for the years ended December 31, 2024, 2023 and 2022 Property, plant and equipment $352 $314 Debt issuance costs 894 1,350 Non-capital losses/net operating losses 31,699 27,700 Capital losses - 1,478 Other 124 79 $39,924 $30,921 16. Key management personnel compensation 2024 2023 Salaries and other short-term benefits $4,046 $3,875 Share-based compensation 6,517 7,120 Total compensation $10,563 $10,995 17. Financial Instruments and Risk Management Fixed price swaps ($563) - (continued) The Company has a non-capital loss balance of C$31.9 million for Canadian tax purposes which expires between 2031 and 2044. For US tax purposes, the Company has a net operating loss balance of US$60.6 million, US$43.7 million of which will expire between 2034 and 2037 and US$16.9 million which do not expire. As at December 31, 2024, the Company had recorded a basis of approximately C$1.0 million and US$133.5 million in depletable and depreciable assets for tax purposes. Year ended December 31, Key management personnel include the directors and officers of the Company and is summarized below: Financial instruments The Company’s financial instruments include cash and cash equivalents, accounts receivable, restricted cash, accounts payable and accrued liabilities, senior credit facility, financial derivative assets and liabilities, and lease liabilities. Financial derivatives are measured at fair value through profit or loss. The Company’s remaining financial instruments are measured at amortized cost. The fair value of cash and cash equivalents, accounts receivable, restricted cash and accounts payable approximate their carrying amount due to the highly liquid or short-term nature of these instruments. The fair value of the senior credit facility approximates the carrying amount due to the floating rate of interest and the margin charged by the lending syndicate being indicative of current spreads. The following table summarizes the Company’s financial instruments that are carried at fair value as a financial derivative liability on the Consolidated Statements of Financial Position: As at December 31, 2024 As at December 31, 2023 As at December 31, 2023As at December 31, 2024 Deferred tax assets have not been recognized in respect of the following deductible temporary differences: Lucero Energy Corp. 2024 Page 23
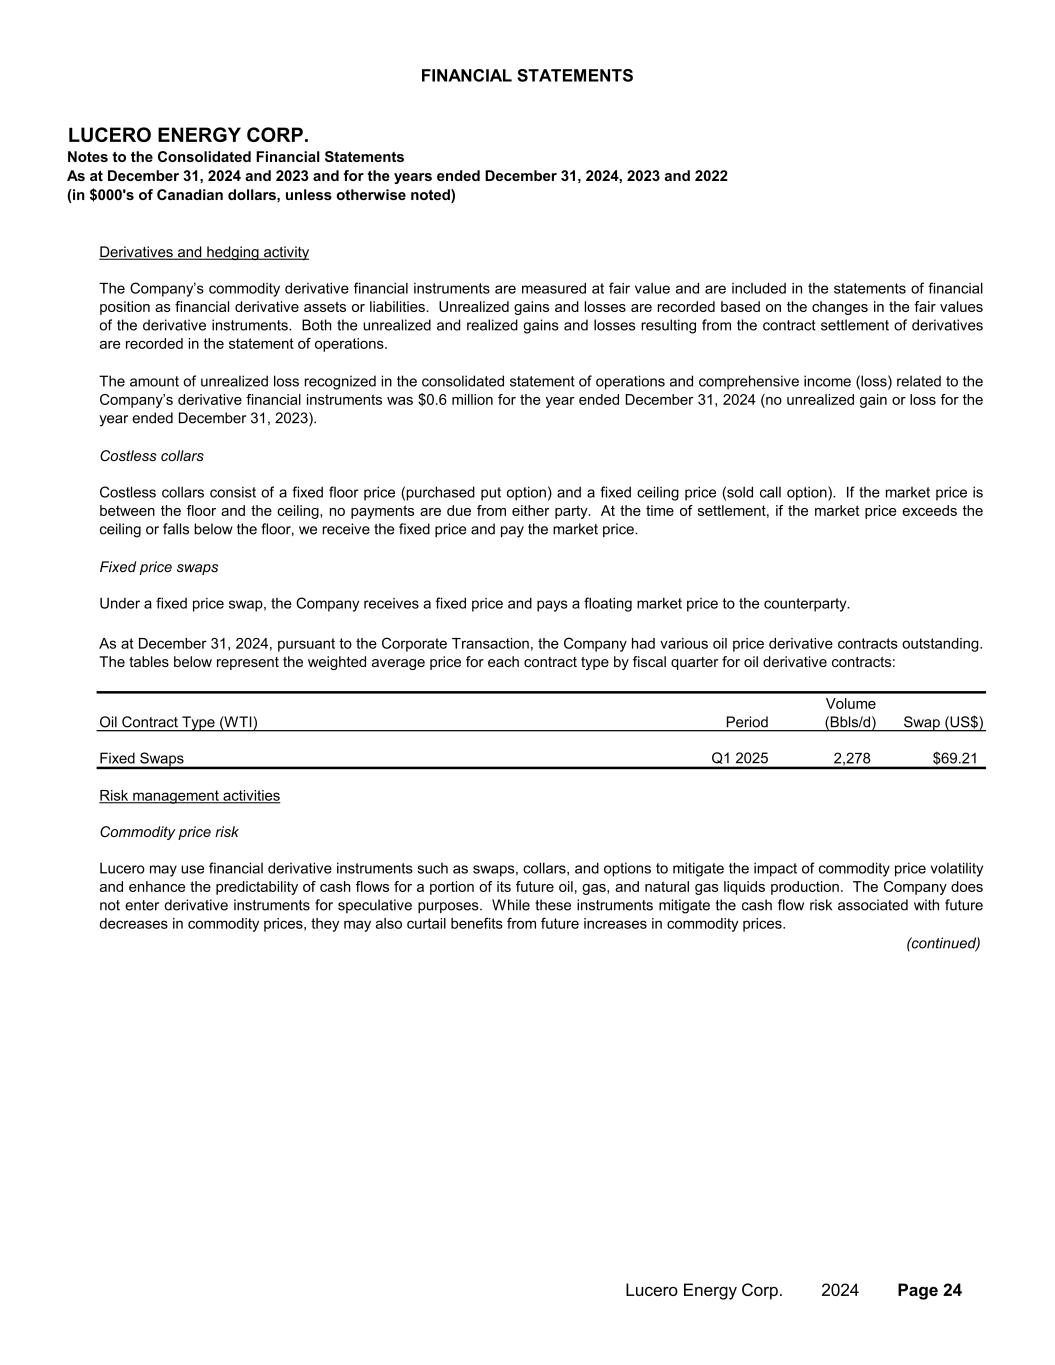
FINANCIAL STATEMENTS LUCERO ENERGY CORP. Notes to the Consolidated Financial Statements (in $000's of Canadian dollars, unless otherwise noted) As at December 31, 2024 and 2023 and for the years ended December 31, 2024, 2023 and 2022 Costless collars Fixed price swaps Oil Contract Type (WTI) Period Volume (Bbls/d) Swap (US$) Fixed Swaps Q1 2025 2,278 $69.21 Commodity price risk (continued) Derivatives and hedging activity Lucero may use financial derivative instruments such as swaps, collars, and options to mitigate the impact of commodity price volatility and enhance the predictability of cash flows for a portion of its future oil, gas, and natural gas liquids production. The Company does not enter derivative instruments for speculative purposes. While these instruments mitigate the cash flow risk associated with future decreases in commodity prices, they may also curtail benefits from future increases in commodity prices. Risk management activities The Company’s commodity derivative financial instruments are measured at fair value and are included in the statements of financial position as financial derivative assets or liabilities. Unrealized gains and losses are recorded based on the changes in the fair values of the derivative instruments. Both the unrealized and realized gains and losses resulting from the contract settlement of derivatives are recorded in the statement of operations. The amount of unrealized loss recognized in the consolidated statement of operations and comprehensive income (loss) related to the Company’s derivative financial instruments was $0.6 million for the year ended December 31, 2024 (no unrealized gain or loss for the year ended December 31, 2023). Costless collars consist of a fixed floor price (purchased put option) and a fixed ceiling price (sold call option). If the market price is between the floor and the ceiling, no payments are due from either party. At the time of settlement, if the market price exceeds the ceiling or falls below the floor, we receive the fixed price and pay the market price. Under a fixed price swap, the Company receives a fixed price and pays a floating market price to the counterparty. As at December 31, 2024, pursuant to the Corporate Transaction, the Company had various oil price derivative contracts outstanding. The tables below represent the weighted average price for each contract type by fiscal quarter for oil derivative contracts: Lucero Energy Corp. 2024 Page 24
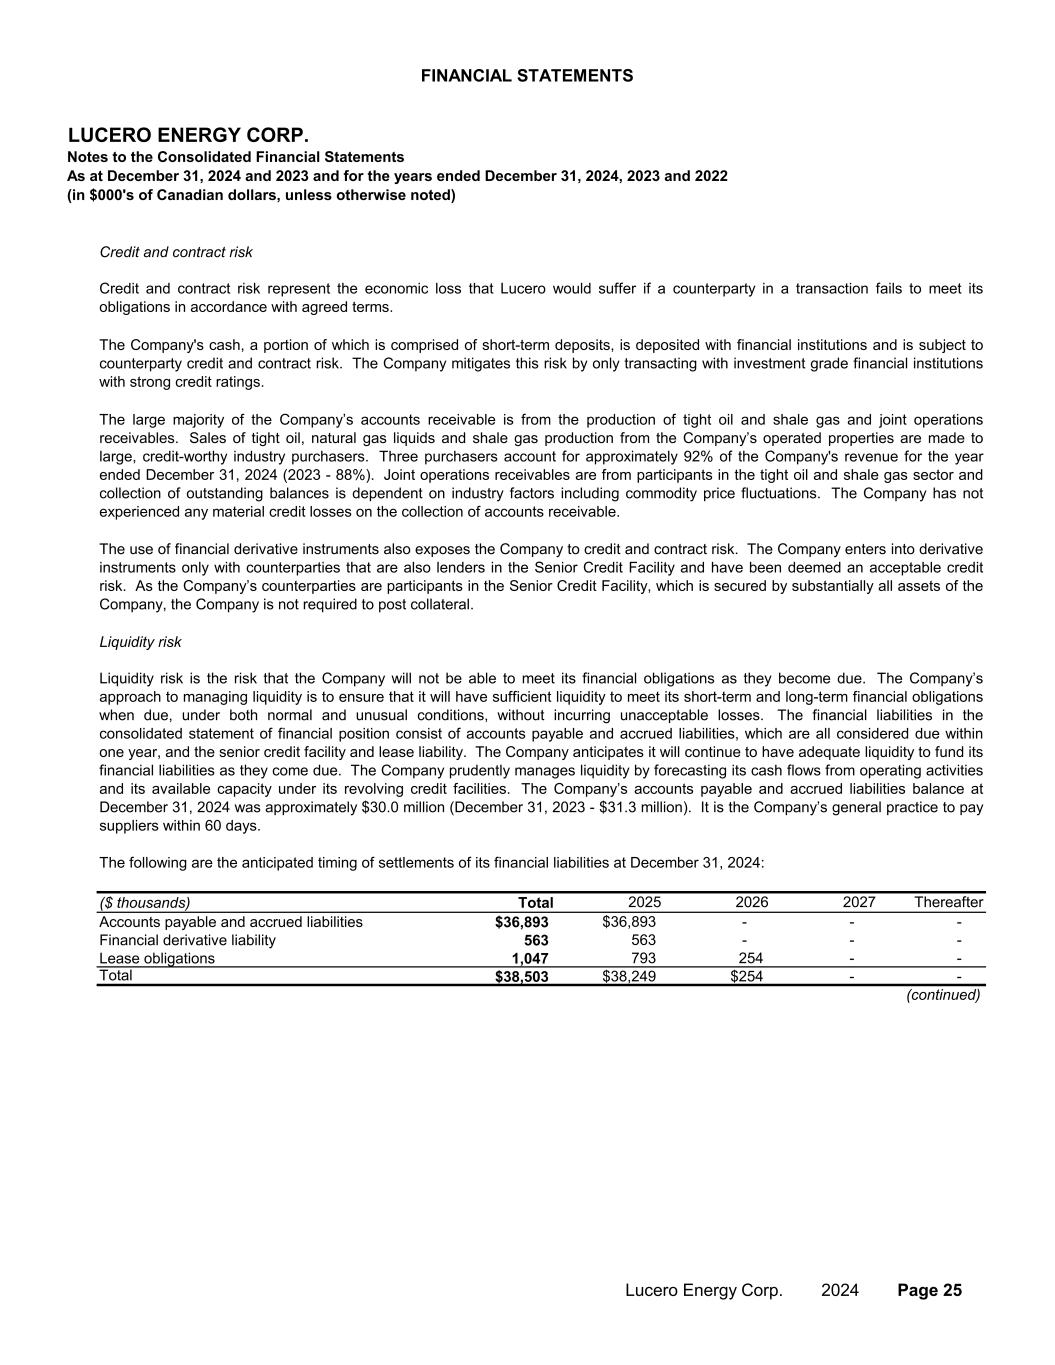
FINANCIAL STATEMENTS LUCERO ENERGY CORP. Notes to the Consolidated Financial Statements (in $000's of Canadian dollars, unless otherwise noted) As at December 31, 2024 and 2023 and for the years ended December 31, 2024, 2023 and 2022 Credit and contract risk Liquidity risk ($ thousands) Total 2025 2026 2027 Thereafter Accounts payable and accrued liabilities $36,893 $36,893 - - - Financial derivative liability 563 563 - - - Lease obligations 1,047 793 254 - - Total $38,503 $38,249 $254 - - (continued) The large majority of the Company’s accounts receivable is from the production of tight oil and shale gas and joint operations receivables. Sales of tight oil, natural gas liquids and shale gas production from the Company’s operated properties are made to large, credit-worthy industry purchasers. Three purchasers account for approximately 92% of the Company's revenue for the year ended December 31, 2024 (2023 - 88%). Joint operations receivables are from participants in the tight oil and shale gas sector and collection of outstanding balances is dependent on industry factors including commodity price fluctuations. The Company has not experienced any material credit losses on the collection of accounts receivable. The use of financial derivative instruments also exposes the Company to credit and contract risk. The Company enters into derivative instruments only with counterparties that are also lenders in the Senior Credit Facility and have been deemed an acceptable credit risk. As the Company’s counterparties are participants in the Senior Credit Facility, which is secured by substantially all assets of the Company, the Company is not required to post collateral. Liquidity risk is the risk that the Company will not be able to meet its financial obligations as they become due. The Company’s approach to managing liquidity is to ensure that it will have sufficient liquidity to meet its short-term and long-term financial obligations when due, under both normal and unusual conditions, without incurring unacceptable losses. The financial liabilities in the consolidated statement of financial position consist of accounts payable and accrued liabilities, which are all considered due within one year, and the senior credit facility and lease liability. The Company anticipates it will continue to have adequate liquidity to fund its financial liabilities as they come due. The Company prudently manages liquidity by forecasting its cash flows from operating activities and its available capacity under its revolving credit facilities. The Company’s accounts payable and accrued liabilities balance at December 31, 2024 was approximately $30.0 million (December 31, 2023 - $31.3 million). It is the Company’s general practice to pay suppliers within 60 days. The following are the anticipated timing of settlements of its financial liabilities at December 31, 2024: The Company's cash, a portion of which is comprised of short-term deposits, is deposited with financial institutions and is subject to counterparty credit and contract risk. The Company mitigates this risk by only transacting with investment grade financial institutions with strong credit ratings. Credit and contract risk represent the economic loss that Lucero would suffer if a counterparty in a transaction fails to meet its obligations in accordance with agreed terms. Lucero Energy Corp. 2024 Page 25
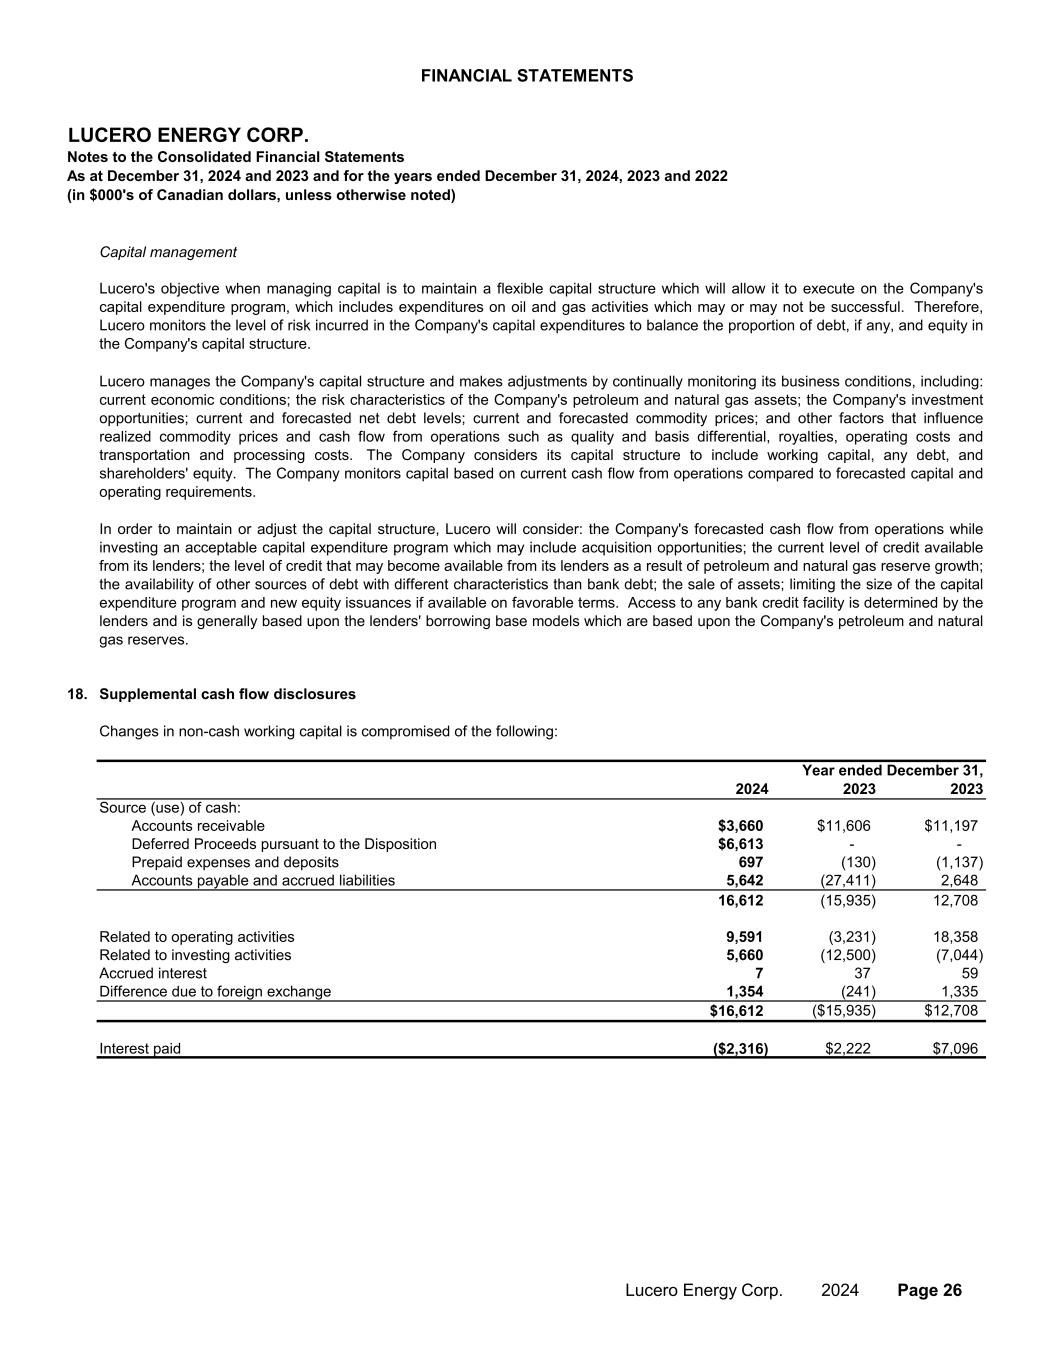
FINANCIAL STATEMENTS LUCERO ENERGY CORP. Notes to the Consolidated Financial Statements (in $000's of Canadian dollars, unless otherwise noted) As at December 31, 2024 and 2023 and for the years ended December 31, 2024, 2023 and 2022 Capital management 18. Supplemental cash flow disclosures 2024 2023 2023 Source (use) of cash: 2,635 Accounts receivable $3,660 $11,606 $11,197 Deferred Proceeds pursuant to the Disposition $6,613 - - Prepaid expenses and deposits 697 (130) (1,137) Accounts payable and accrued liabilities 5,642 (27,411) 2,648 16,612 (15,935) 12,708 Related to operating activities 9,591 (3,231) 18,358 Related to investing activities 5,660 (12,500) (7,044) Accrued interest 7 37 59 Difference due to foreign exchange 1,354 (241) 1,335 $16,612 ($15,935) $12,708 Interest paid ($2,316) $2,222 $7,096 Lucero's objective when managing capital is to maintain a flexible capital structure which will allow it to execute on the Company's capital expenditure program, which includes expenditures on oil and gas activities which may or may not be successful. Therefore, Lucero monitors the level of risk incurred in the Company's capital expenditures to balance the proportion of debt, if any, and equity in the Company's capital structure. Lucero manages the Company's capital structure and makes adjustments by continually monitoring its business conditions, including: current economic conditions; the risk characteristics of the Company's petroleum and natural gas assets; the Company's investment opportunities; current and forecasted net debt levels; current and forecasted commodity prices; and other factors that influence realized commodity prices and cash flow from operations such as quality and basis differential, royalties, operating costs and transportation and processing costs. The Company considers its capital structure to include working capital, any debt, and shareholders' equity. The Company monitors capital based on current cash flow from operations compared to forecasted capital and operating requirements. Changes in non-cash working capital is compromised of the following: Year ended December 31, In order to maintain or adjust the capital structure, Lucero will consider: the Company's forecasted cash flow from operations while investing an acceptable capital expenditure program which may include acquisition opportunities; the current level of credit available from its lenders; the level of credit that may become available from its lenders as a result of petroleum and natural gas reserve growth; the availability of other sources of debt with different characteristics than bank debt; the sale of assets; limiting the size of the capital expenditure program and new equity issuances if available on favorable terms. Access to any bank credit facility is determined by the lenders and is generally based upon the lenders' borrowing base models which are based upon the Company's petroleum and natural gas reserves. Lucero Energy Corp. 2024 Page 26
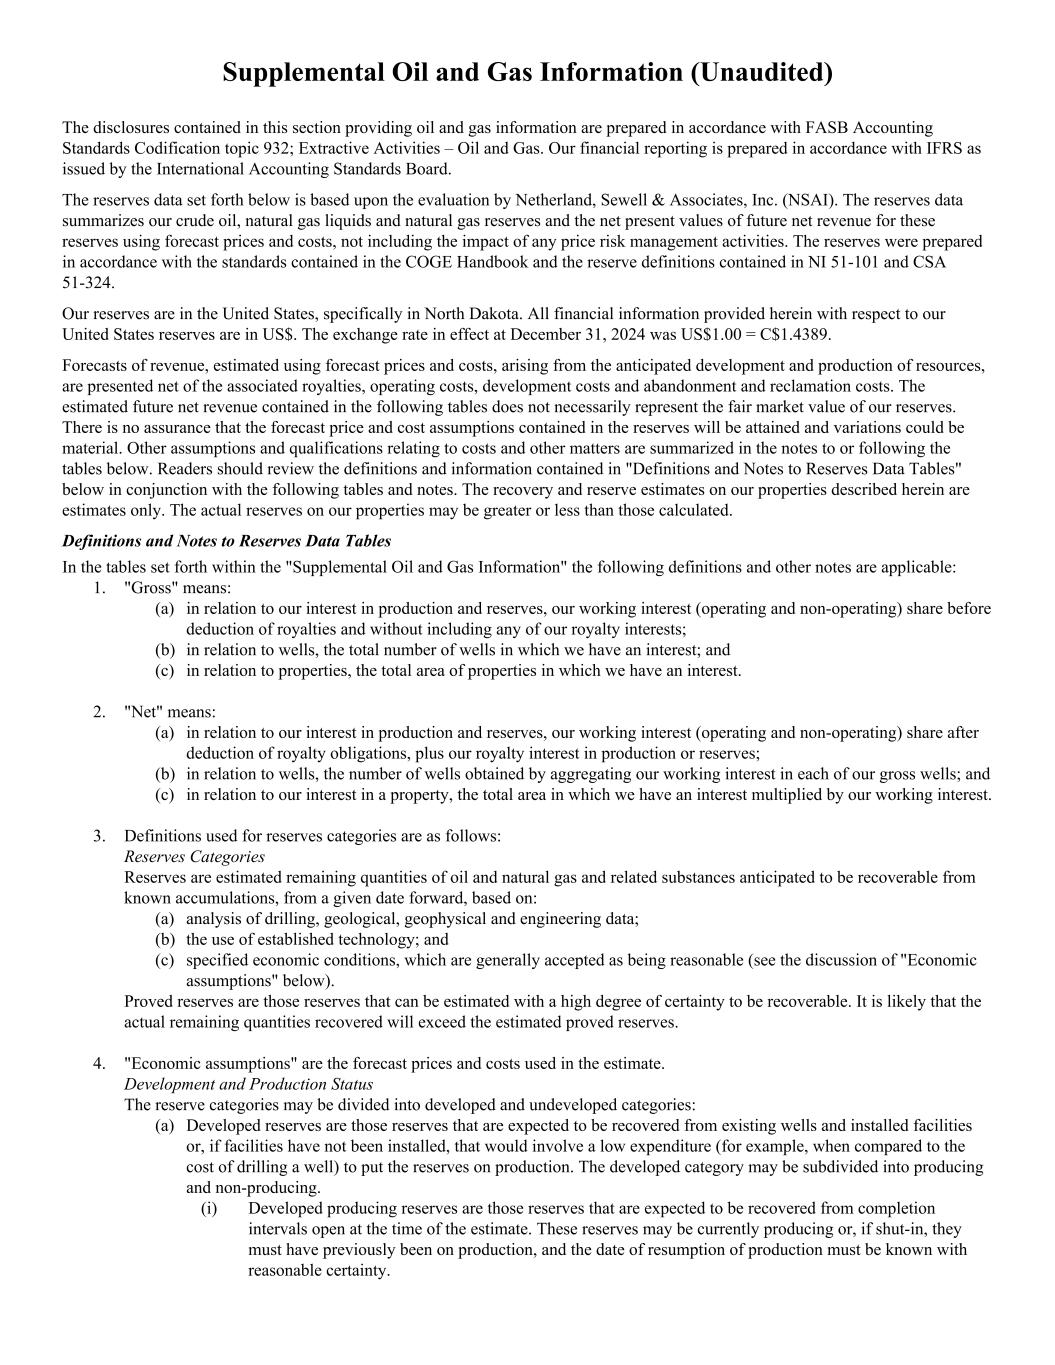
Supplemental Oil and Gas Information (Unaudited) The disclosures contained in this section providing oil and gas information are prepared in accordance with FASB Accounting Standards Codification topic 932; Extractive Activities – Oil and Gas. Our financial reporting is prepared in accordance with IFRS as issued by the International Accounting Standards Board. The reserves data set forth below is based upon the evaluation by Netherland, Sewell & Associates, Inc. (NSAI). The reserves data summarizes our crude oil, natural gas liquids and natural gas reserves and the net present values of future net revenue for these reserves using forecast prices and costs, not including the impact of any price risk management activities. The reserves were prepared in accordance with the standards contained in the COGE Handbook and the reserve definitions contained in NI 51-101 and CSA 51-324. Our reserves are in the United States, specifically in North Dakota. All financial information provided herein with respect to our United States reserves are in US$. The exchange rate in effect at December 31, 2024 was US$1.00 = C$1.4389. Forecasts of revenue, estimated using forecast prices and costs, arising from the anticipated development and production of resources, are presented net of the associated royalties, operating costs, development costs and abandonment and reclamation costs. The estimated future net revenue contained in the following tables does not necessarily represent the fair market value of our reserves. There is no assurance that the forecast price and cost assumptions contained in the reserves will be attained and variations could be material. Other assumptions and qualifications relating to costs and other matters are summarized in the notes to or following the tables below. Readers should review the definitions and information contained in "Definitions and Notes to Reserves Data Tables" below in conjunction with the following tables and notes. The recovery and reserve estimates on our properties described herein are estimates only. The actual reserves on our properties may be greater or less than those calculated. Definitions and Notes to Reserves Data Tables In the tables set forth within the "Supplemental Oil and Gas Information" the following definitions and other notes are applicable: 1. "Gross" means: (a) in relation to our interest in production and reserves, our working interest (operating and non-operating) share before deduction of royalties and without including any of our royalty interests; (b) in relation to wells, the total number of wells in which we have an interest; and (c) in relation to properties, the total area of properties in which we have an interest. 2. "Net" means: (a) in relation to our interest in production and reserves, our working interest (operating and non-operating) share after deduction of royalty obligations, plus our royalty interest in production or reserves; (b) in relation to wells, the number of wells obtained by aggregating our working interest in each of our gross wells; and (c) in relation to our interest in a property, the total area in which we have an interest multiplied by our working interest. 3. Definitions used for reserves categories are as follows: Reserves Categories Reserves are estimated remaining quantities of oil and natural gas and related substances anticipated to be recoverable from known accumulations, from a given date forward, based on: (a) analysis of drilling, geological, geophysical and engineering data; (b) the use of established technology; and (c) specified economic conditions, which are generally accepted as being reasonable (see the discussion of "Economic assumptions" below). Proved reserves are those reserves that can be estimated with a high degree of certainty to be recoverable. It is likely that the actual remaining quantities recovered will exceed the estimated proved reserves. 4. "Economic assumptions" are the forecast prices and costs used in the estimate. Development and Production Status The reserve categories may be divided into developed and undeveloped categories: (a) Developed reserves are those reserves that are expected to be recovered from existing wells and installed facilities or, if facilities have not been installed, that would involve a low expenditure (for example, when compared to the cost of drilling a well) to put the reserves on production. The developed category may be subdivided into producing and non-producing. (i) Developed producing reserves are those reserves that are expected to be recovered from completion intervals open at the time of the estimate. These reserves may be currently producing or, if shut-in, they must have previously been on production, and the date of resumption of production must be known with reasonable certainty.
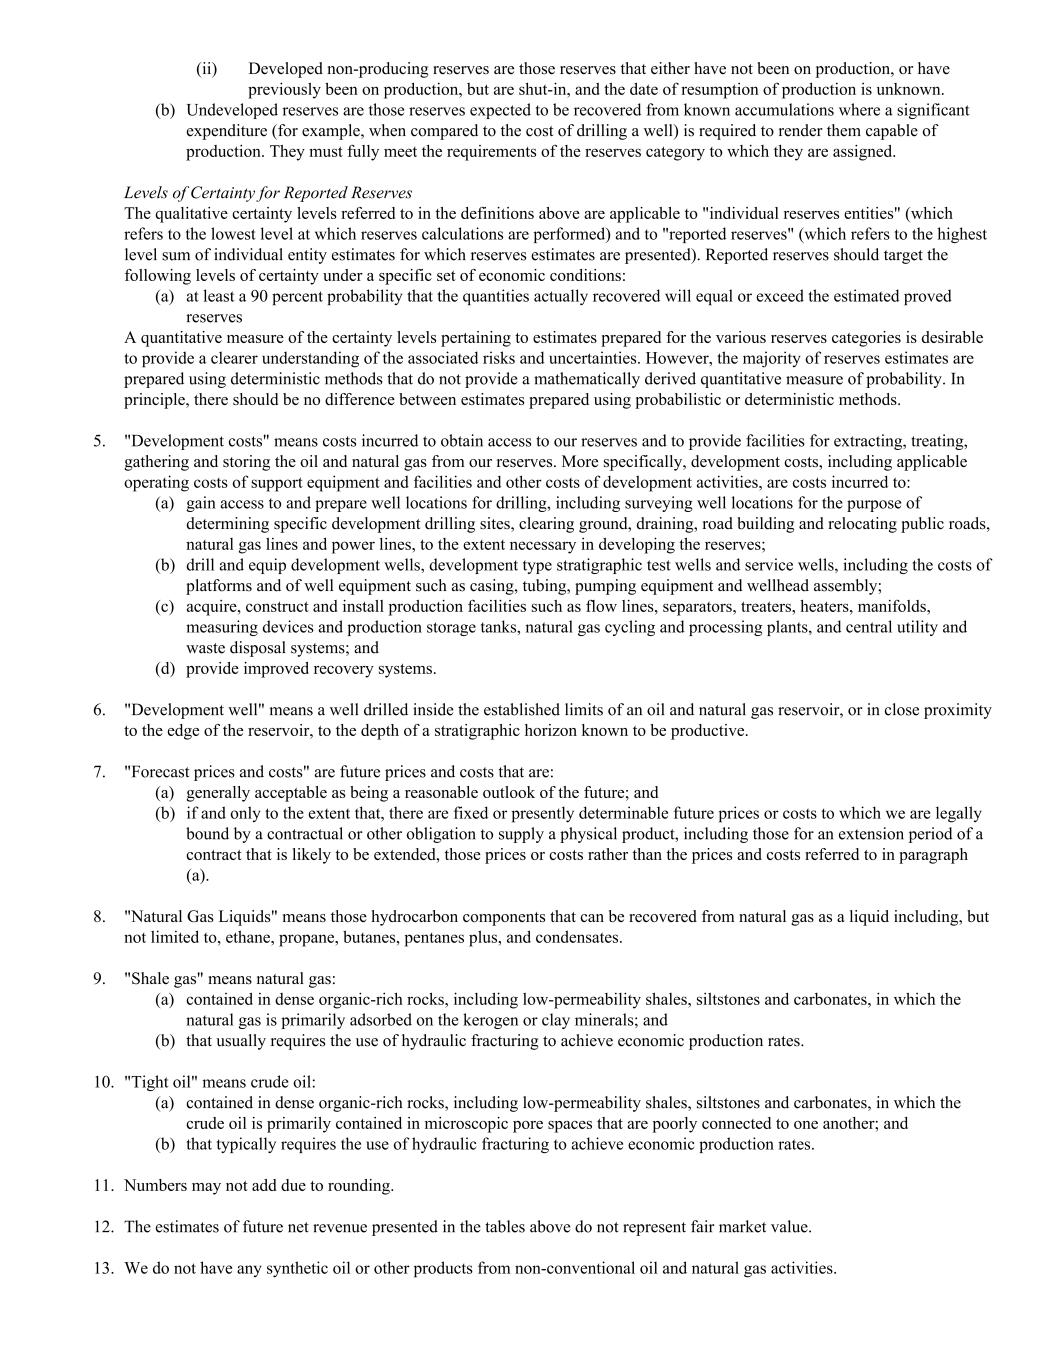
(ii) Developed non-producing reserves are those reserves that either have not been on production, or have previously been on production, but are shut-in, and the date of resumption of production is unknown. (b) Undeveloped reserves are those reserves expected to be recovered from known accumulations where a significant expenditure (for example, when compared to the cost of drilling a well) is required to render them capable of production. They must fully meet the requirements of the reserves category to which they are assigned. Levels of Certainty for Reported Reserves The qualitative certainty levels referred to in the definitions above are applicable to "individual reserves entities" (which refers to the lowest level at which reserves calculations are performed) and to "reported reserves" (which refers to the highest level sum of individual entity estimates for which reserves estimates are presented). Reported reserves should target the following levels of certainty under a specific set of economic conditions: (a) at least a 90 percent probability that the quantities actually recovered will equal or exceed the estimated proved reserves A quantitative measure of the certainty levels pertaining to estimates prepared for the various reserves categories is desirable to provide a clearer understanding of the associated risks and uncertainties. However, the majority of reserves estimates are prepared using deterministic methods that do not provide a mathematically derived quantitative measure of probability. In principle, there should be no difference between estimates prepared using probabilistic or deterministic methods. 5. "Development costs" means costs incurred to obtain access to our reserves and to provide facilities for extracting, treating, gathering and storing the oil and natural gas from our reserves. More specifically, development costs, including applicable operating costs of support equipment and facilities and other costs of development activities, are costs incurred to: (a) gain access to and prepare well locations for drilling, including surveying well locations for the purpose of determining specific development drilling sites, clearing ground, draining, road building and relocating public roads, natural gas lines and power lines, to the extent necessary in developing the reserves; (b) drill and equip development wells, development type stratigraphic test wells and service wells, including the costs of platforms and of well equipment such as casing, tubing, pumping equipment and wellhead assembly; (c) acquire, construct and install production facilities such as flow lines, separators, treaters, heaters, manifolds, measuring devices and production storage tanks, natural gas cycling and processing plants, and central utility and waste disposal systems; and (d) provide improved recovery systems. 6. "Development well" means a well drilled inside the established limits of an oil and natural gas reservoir, or in close proximity to the edge of the reservoir, to the depth of a stratigraphic horizon known to be productive. 7. "Forecast prices and costs" are future prices and costs that are: (a) generally acceptable as being a reasonable outlook of the future; and (b) if and only to the extent that, there are fixed or presently determinable future prices or costs to which we are legally bound by a contractual or other obligation to supply a physical product, including those for an extension period of a contract that is likely to be extended, those prices or costs rather than the prices and costs referred to in paragraph (a). 8. "Natural Gas Liquids" means those hydrocarbon components that can be recovered from natural gas as a liquid including, but not limited to, ethane, propane, butanes, pentanes plus, and condensates. 9. "Shale gas" means natural gas: (a) contained in dense organic-rich rocks, including low-permeability shales, siltstones and carbonates, in which the natural gas is primarily adsorbed on the kerogen or clay minerals; and (b) that usually requires the use of hydraulic fracturing to achieve economic production rates. 10. "Tight oil" means crude oil: (a) contained in dense organic-rich rocks, including low-permeability shales, siltstones and carbonates, in which the crude oil is primarily contained in microscopic pore spaces that are poorly connected to one another; and (b) that typically requires the use of hydraulic fracturing to achieve economic production rates. 11. Numbers may not add due to rounding. 12. The estimates of future net revenue presented in the tables above do not represent fair market value. 13. We do not have any synthetic oil or other products from non-conventional oil and natural gas activities.
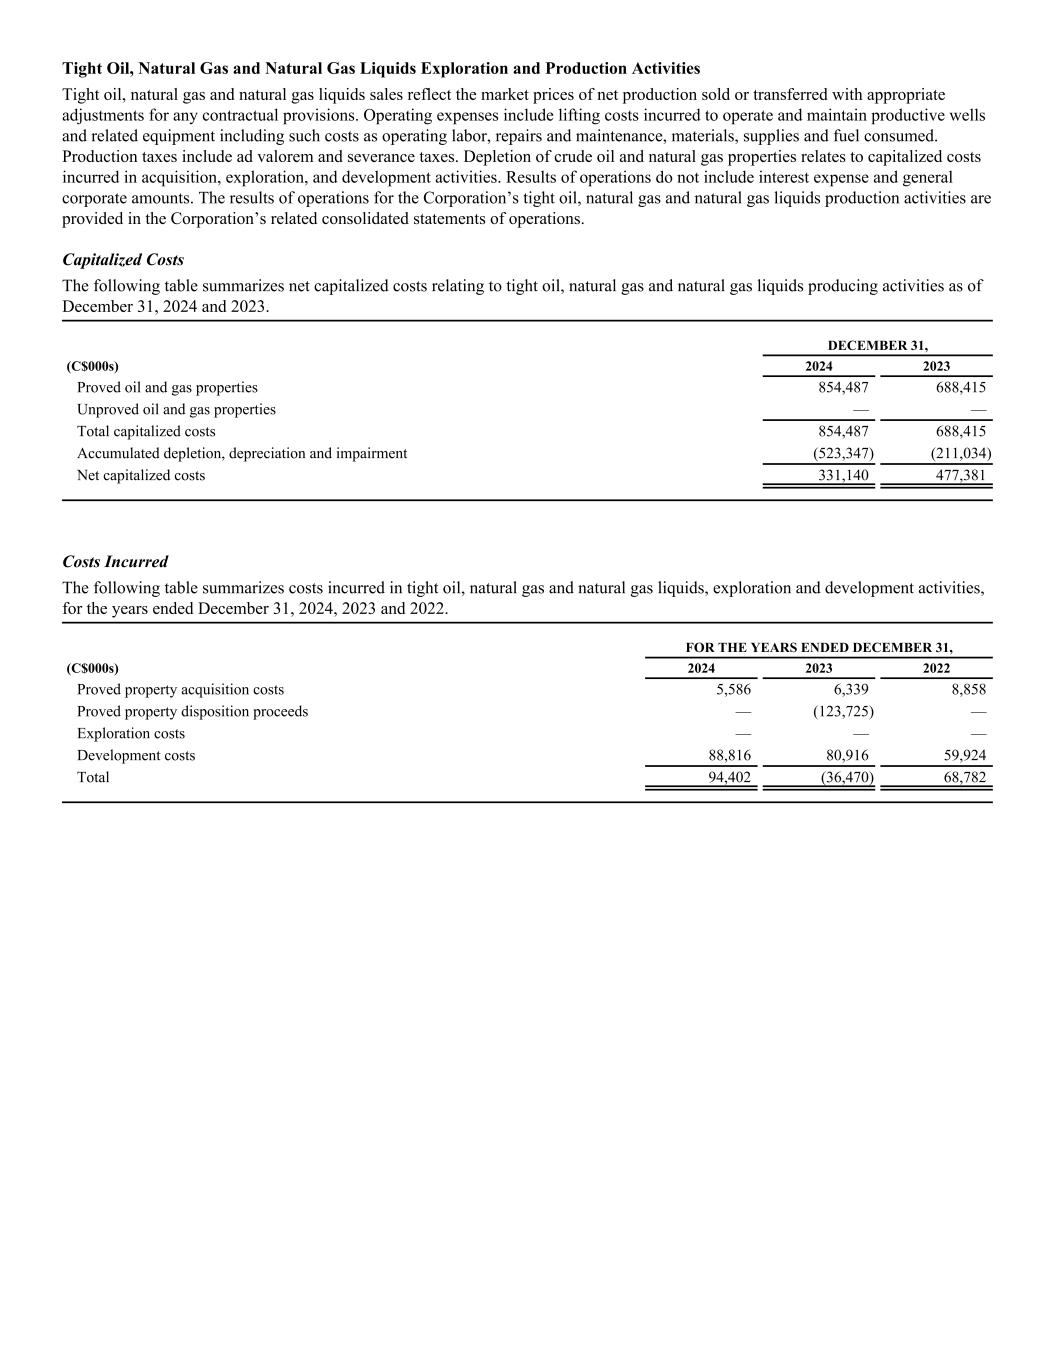
Tight Oil, Natural Gas and Natural Gas Liquids Exploration and Production Activities Tight oil, natural gas and natural gas liquids sales reflect the market prices of net production sold or transferred with appropriate adjustments for any contractual provisions. Operating expenses include lifting costs incurred to operate and maintain productive wells and related equipment including such costs as operating labor, repairs and maintenance, materials, supplies and fuel consumed. Production taxes include ad valorem and severance taxes. Depletion of crude oil and natural gas properties relates to capitalized costs incurred in acquisition, exploration, and development activities. Results of operations do not include interest expense and general corporate amounts. The results of operations for the Corporation’s tight oil, natural gas and natural gas liquids production activities are provided in the Corporation’s related consolidated statements of operations. Capitalized Costs The following table summarizes net capitalized costs relating to tight oil, natural gas and natural gas liquids producing activities as of December 31, 2024 and 2023. DECEMBER 31, (C$000s) 2024 2023 Proved oil and gas properties 854,487 688,415 Unproved oil and gas properties — — Total capitalized costs 854,487 688,415 Accumulated depletion, depreciation and impairment (523,347) (211,034) Net capitalized costs 331,140 477,381 Costs Incurred The following table summarizes costs incurred in tight oil, natural gas and natural gas liquids, exploration and development activities, for the years ended December 31, 2024, 2023 and 2022. FOR THE YEARS ENDED DECEMBER 31, (C$000s) 2024 2023 2022 Proved property acquisition costs 5,586 6,339 8,858 Proved property disposition proceeds — (123,725) — Exploration costs — — — Development costs 88,816 80,916 59,924 Total 94,402 (36,470) 68,782
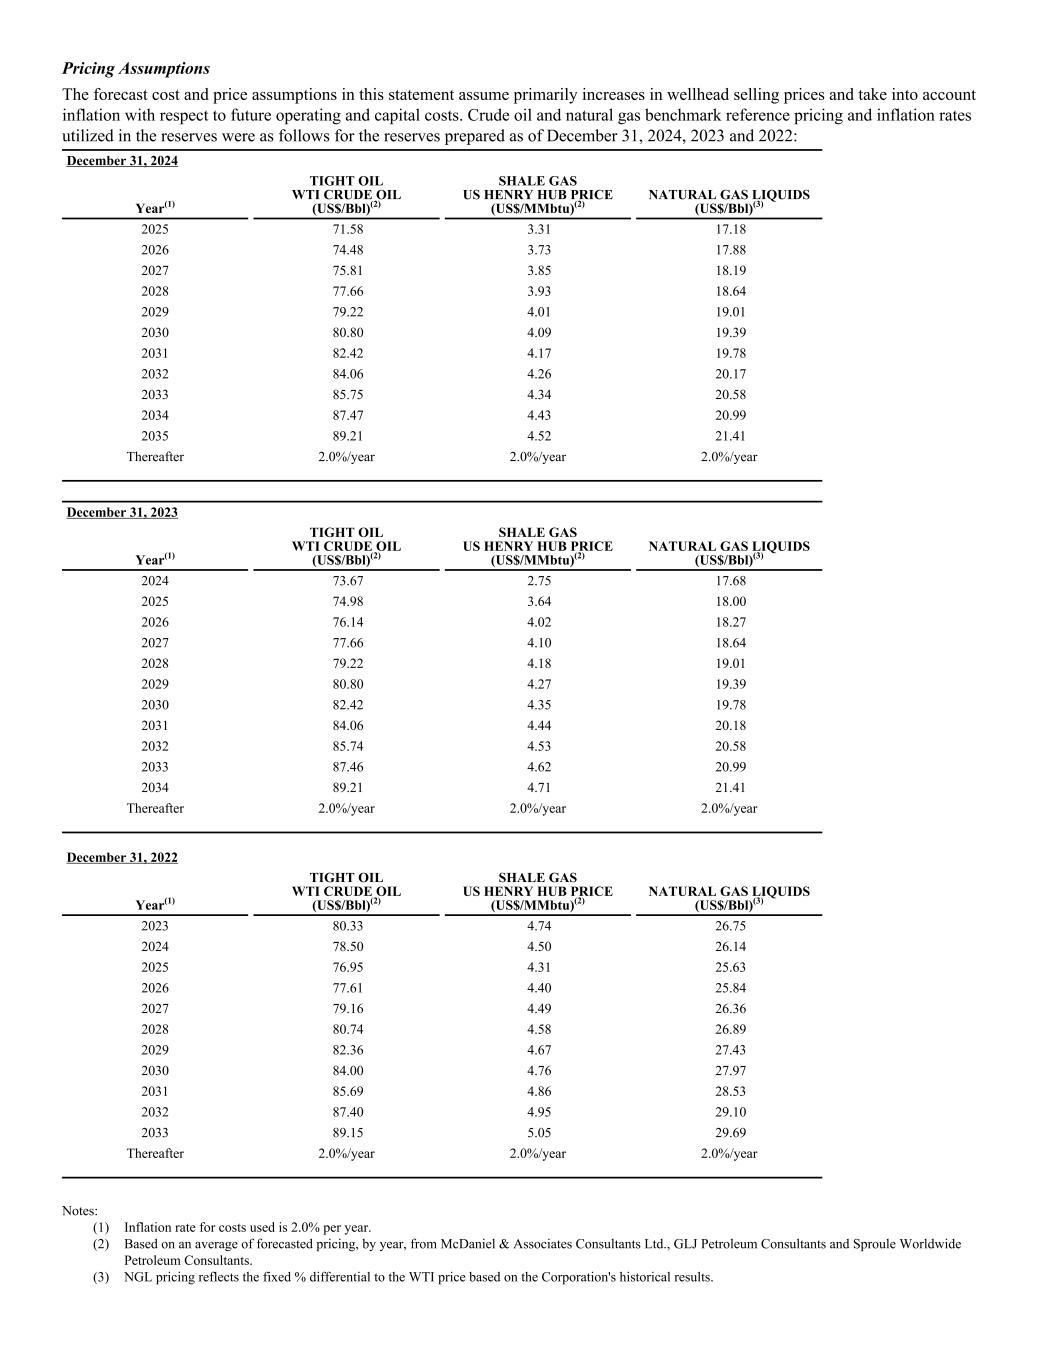
Pricing Assumptions The forecast cost and price assumptions in this statement assume primarily increases in wellhead selling prices and take into account inflation with respect to future operating and capital costs. Crude oil and natural gas benchmark reference pricing and inflation rates utilized in the reserves were as follows for the reserves prepared as of December 31, 2024, 2023 and 2022: December 31, 2024 Year(1) TIGHT OIL WTI CRUDE OIL (US$/Bbl)(2) SHALE GAS US HENRY HUB PRICE (US$/MMbtu)(2) NATURAL GAS LIQUIDS (US$/Bbl)(3) 2025 71.58 3.31 17.18 2026 74.48 3.73 17.88 2027 75.81 3.85 18.19 2028 77.66 3.93 18.64 2029 79.22 4.01 19.01 2030 80.80 4.09 19.39 2031 82.42 4.17 19.78 2032 84.06 4.26 20.17 2033 85.75 4.34 20.58 2034 87.47 4.43 20.99 2035 89.21 4.52 21.41 Thereafter 2.0%/year 2.0%/year 2.0%/year December 31, 2023 Year(1) TIGHT OIL WTI CRUDE OIL (US$/Bbl)(2) SHALE GAS US HENRY HUB PRICE (US$/MMbtu)(2) NATURAL GAS LIQUIDS (US$/Bbl)(3) 2024 73.67 2.75 17.68 2025 74.98 3.64 18.00 2026 76.14 4.02 18.27 2027 77.66 4.10 18.64 2028 79.22 4.18 19.01 2029 80.80 4.27 19.39 2030 82.42 4.35 19.78 2031 84.06 4.44 20.18 2032 85.74 4.53 20.58 2033 87.46 4.62 20.99 2034 89.21 4.71 21.41 Thereafter 2.0%/year 2.0%/year 2.0%/year December 31, 2022 Year(1) TIGHT OIL WTI CRUDE OIL (US$/Bbl)(2) SHALE GAS US HENRY HUB PRICE (US$/MMbtu)(2) NATURAL GAS LIQUIDS (US$/Bbl)(3) 2023 80.33 4.74 26.75 2024 78.50 4.50 26.14 2025 76.95 4.31 25.63 2026 77.61 4.40 25.84 2027 79.16 4.49 26.36 2028 80.74 4.58 26.89 2029 82.36 4.67 27.43 2030 84.00 4.76 27.97 2031 85.69 4.86 28.53 2032 87.40 4.95 29.10 2033 89.15 5.05 29.69 Thereafter 2.0%/year 2.0%/year 2.0%/year Notes: (1) Inflation rate for costs used is 2.0% per year. (2) Based on an average of forecasted pricing, by year, from McDaniel & Associates Consultants Ltd., GLJ Petroleum Consultants and Sproule Worldwide Petroleum Consultants. (3) NGL pricing reflects the fixed % differential to the WTI price based on the Corporation's historical results.
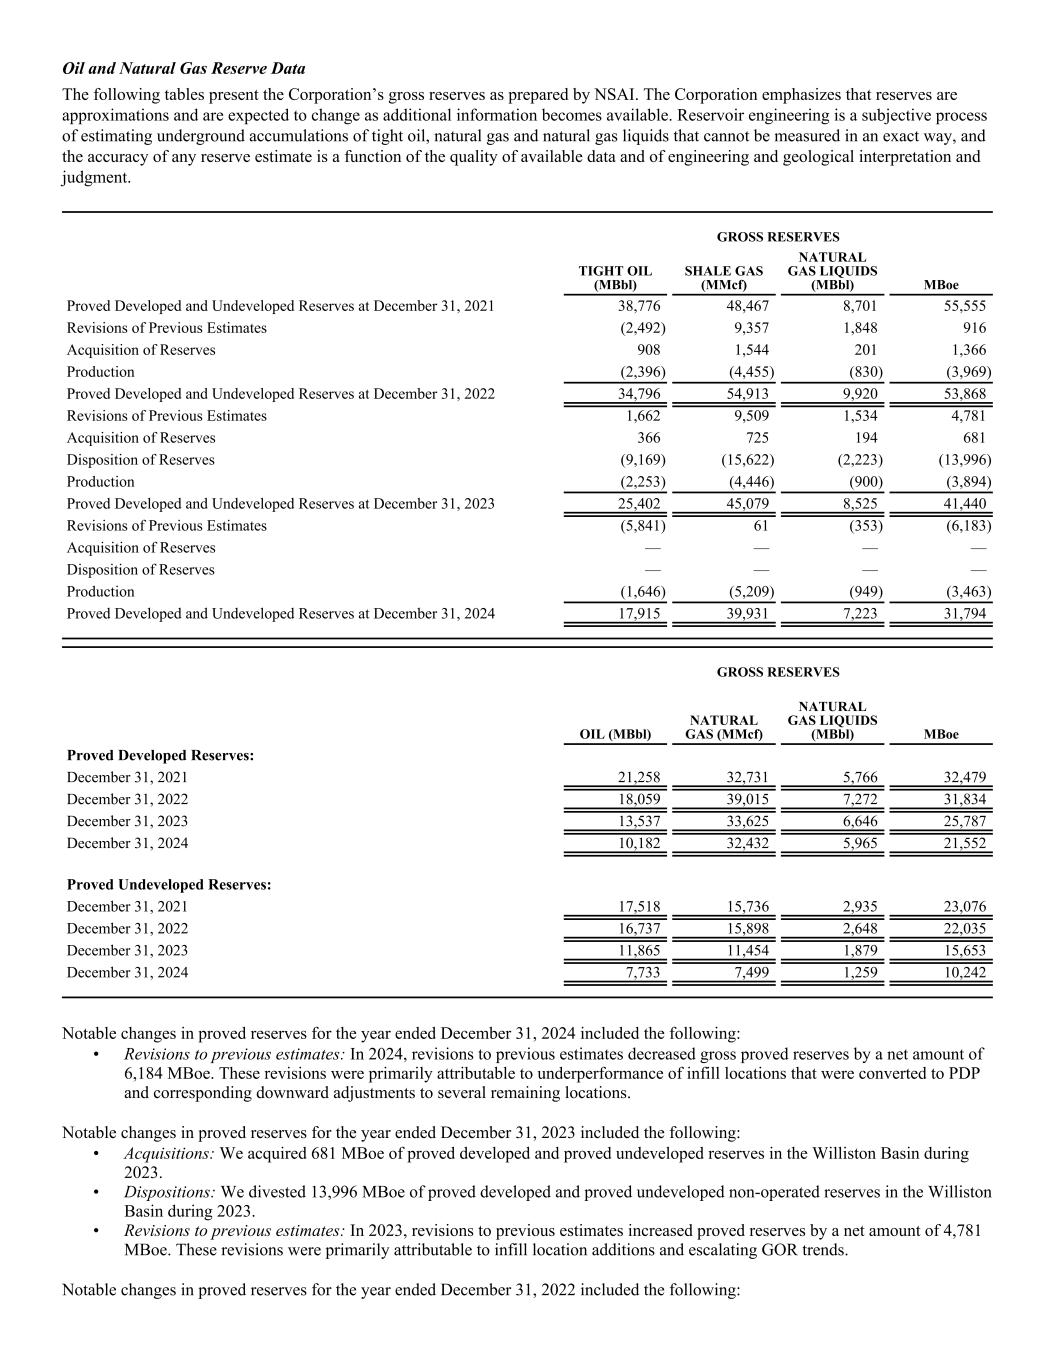
Oil and Natural Gas Reserve Data The following tables present the Corporation’s gross reserves as prepared by NSAI. The Corporation emphasizes that reserves are approximations and are expected to change as additional information becomes available. Reservoir engineering is a subjective process of estimating underground accumulations of tight oil, natural gas and natural gas liquids that cannot be measured in an exact way, and the accuracy of any reserve estimate is a function of the quality of available data and of engineering and geological interpretation and judgment. GROSS RESERVES TIGHT OIL (MBbl) SHALE GAS (MMcf) NATURAL GAS LIQUIDS (MBbl) MBoe Proved Developed and Undeveloped Reserves at December 31, 2021 38,776 48,467 8,701 55,555 Revisions of Previous Estimates (2,492) 9,357 1,848 916 Acquisition of Reserves 908 1,544 201 1,366 Production (2,396) (4,455) (830) (3,969) Proved Developed and Undeveloped Reserves at December 31, 2022 34,796 54,913 9,920 53,868 Revisions of Previous Estimates 1,662 9,509 1,534 4,781 Acquisition of Reserves 366 725 194 681 Disposition of Reserves (9,169) (15,622) (2,223) (13,996) Production (2,253) (4,446) (900) (3,894) Proved Developed and Undeveloped Reserves at December 31, 2023 25,402 45,079 8,525 41,440 Revisions of Previous Estimates (5,841) 61 (353) (6,183) Acquisition of Reserves — — — — Disposition of Reserves — — — — Production (1,646) (5,209) (949) (3,463) Proved Developed and Undeveloped Reserves at December 31, 2024 17,915 39,931 7,223 31,794 GROSS RESERVES OIL (MBbl) NATURAL GAS (MMcf) NATURAL GAS LIQUIDS (MBbl) MBoe Proved Developed Reserves: December 31, 2021 21,258 32,731 5,766 32,479 December 31, 2022 18,059 39,015 7,272 31,834 December 31, 2023 13,537 33,625 6,646 25,787 December 31, 2024 10,182 32,432 5,965 21,552 Proved Undeveloped Reserves: December 31, 2021 17,518 15,736 2,935 23,076 December 31, 2022 16,737 15,898 2,648 22,035 December 31, 2023 11,865 11,454 1,879 15,653 December 31, 2024 7,733 7,499 1,259 10,242 Notable changes in proved reserves for the year ended December 31, 2024 included the following: • Revisions to previous estimates: In 2024, revisions to previous estimates decreased gross proved reserves by a net amount of 6,184 MBoe. These revisions were primarily attributable to underperformance of infill locations that were converted to PDP and corresponding downward adjustments to several remaining locations. Notable changes in proved reserves for the year ended December 31, 2023 included the following: • Acquisitions: We acquired 681 MBoe of proved developed and proved undeveloped reserves in the Williston Basin during 2023. • Dispositions: We divested 13,996 MBoe of proved developed and proved undeveloped non-operated reserves in the Williston Basin during 2023. • Revisions to previous estimates: In 2023, revisions to previous estimates increased proved reserves by a net amount of 4,781 MBoe. These revisions were primarily attributable to infill location additions and escalating GOR trends. Notable changes in proved reserves for the year ended December 31, 2022 included the following:
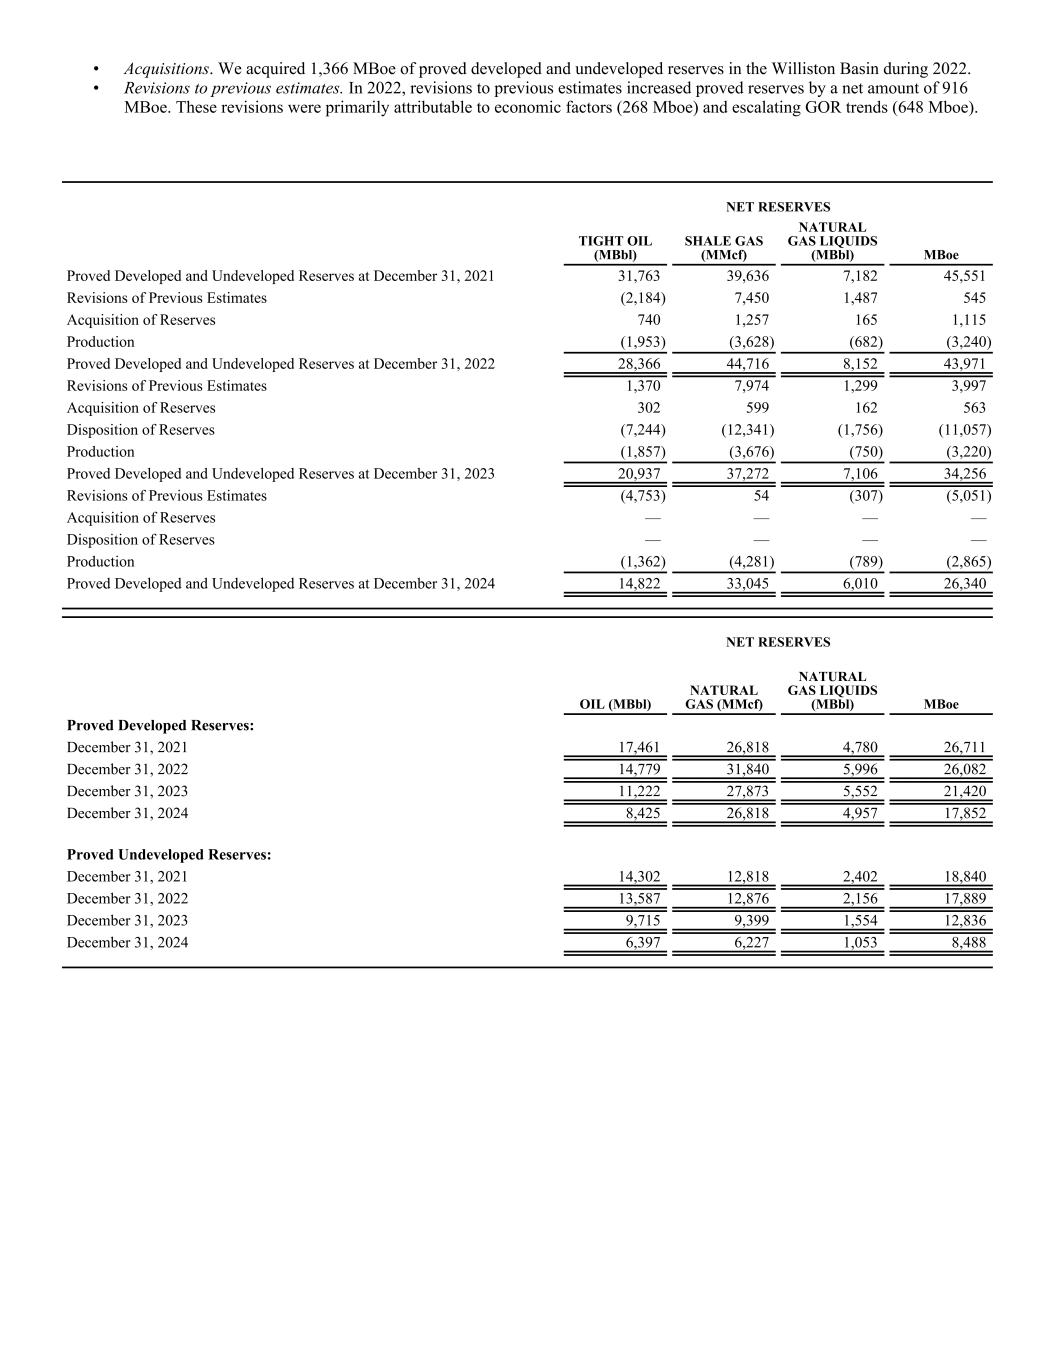
• Acquisitions. We acquired 1,366 MBoe of proved developed and undeveloped reserves in the Williston Basin during 2022. • Revisions to previous estimates. In 2022, revisions to previous estimates increased proved reserves by a net amount of 916 MBoe. These revisions were primarily attributable to economic factors (268 Mboe) and escalating GOR trends (648 Mboe). NET RESERVES TIGHT OIL (MBbl) SHALE GAS (MMcf) NATURAL GAS LIQUIDS (MBbl) MBoe Proved Developed and Undeveloped Reserves at December 31, 2021 31,763 39,636 7,182 45,551 Revisions of Previous Estimates (2,184) 7,450 1,487 545 Acquisition of Reserves 740 1,257 165 1,115 Production (1,953) (3,628) (682) (3,240) Proved Developed and Undeveloped Reserves at December 31, 2022 28,366 44,716 8,152 43,971 Revisions of Previous Estimates 1,370 7,974 1,299 3,997 Acquisition of Reserves 302 599 162 563 Disposition of Reserves (7,244) (12,341) (1,756) (11,057) Production (1,857) (3,676) (750) (3,220) Proved Developed and Undeveloped Reserves at December 31, 2023 20,937 37,272 7,106 34,256 Revisions of Previous Estimates (4,753) 54 (307) (5,051) Acquisition of Reserves — — — — Disposition of Reserves — — — — Production (1,362) (4,281) (789) (2,865) Proved Developed and Undeveloped Reserves at December 31, 2024 14,822 33,045 6,010 26,340 NET RESERVES OIL (MBbl) NATURAL GAS (MMcf) NATURAL GAS LIQUIDS (MBbl) MBoe Proved Developed Reserves: December 31, 2021 17,461 26,818 4,780 26,711 December 31, 2022 14,779 31,840 5,996 26,082 December 31, 2023 11,222 27,873 5,552 21,420 December 31, 2024 8,425 26,818 4,957 17,852 Proved Undeveloped Reserves: December 31, 2021 14,302 12,818 2,402 18,840 December 31, 2022 13,587 12,876 2,156 17,889 December 31, 2023 9,715 9,399 1,554 12,836 December 31, 2024 6,397 6,227 1,053 8,488
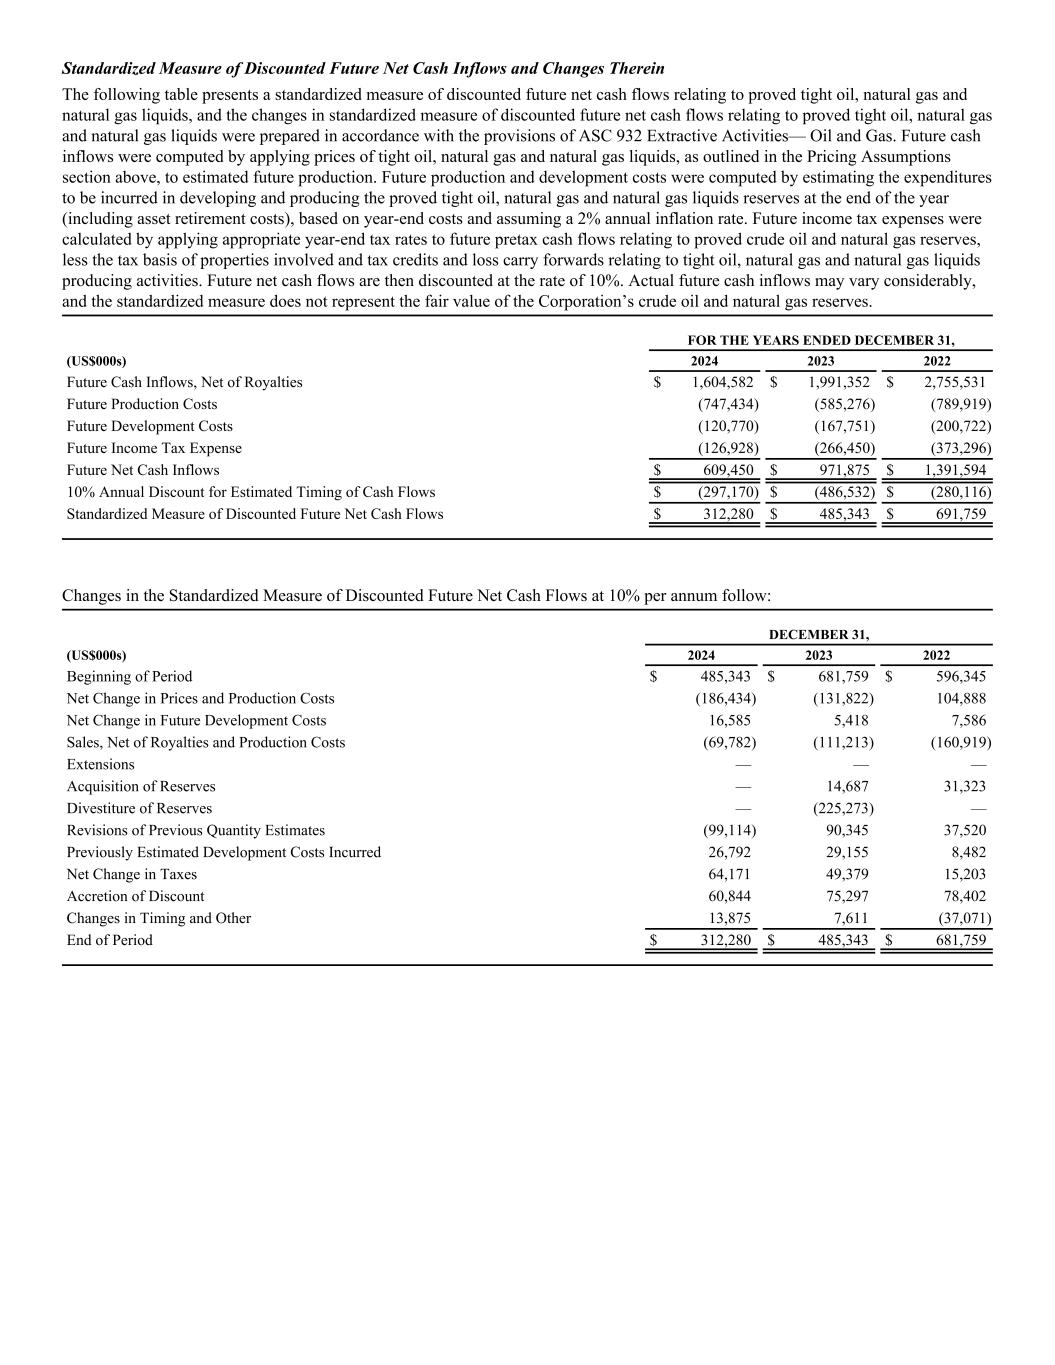
Standardized Measure of Discounted Future Net Cash Inflows and Changes Therein The following table presents a standardized measure of discounted future net cash flows relating to proved tight oil, natural gas and natural gas liquids, and the changes in standardized measure of discounted future net cash flows relating to proved tight oil, natural gas and natural gas liquids were prepared in accordance with the provisions of ASC 932 Extractive Activities— Oil and Gas. Future cash inflows were computed by applying prices of tight oil, natural gas and natural gas liquids, as outlined in the Pricing Assumptions section above, to estimated future production. Future production and development costs were computed by estimating the expenditures to be incurred in developing and producing the proved tight oil, natural gas and natural gas liquids reserves at the end of the year (including asset retirement costs), based on year-end costs and assuming a 2% annual inflation rate. Future income tax expenses were calculated by applying appropriate year-end tax rates to future pretax cash flows relating to proved crude oil and natural gas reserves, less the tax basis of properties involved and tax credits and loss carry forwards relating to tight oil, natural gas and natural gas liquids producing activities. Future net cash flows are then discounted at the rate of 10%. Actual future cash inflows may vary considerably, and the standardized measure does not represent the fair value of the Corporation’s crude oil and natural gas reserves. FOR THE YEARS ENDED DECEMBER 31, (US$000s) 2024 2023 2022 Future Cash Inflows, Net of Royalties $ 1,604,582 $ 1,991,352 $ 2,755,531 Future Production Costs (747,434) (585,276) (789,919) Future Development Costs (120,770) (167,751) (200,722) Future Income Tax Expense (126,928) (266,450) (373,296) Future Net Cash Inflows $ 609,450 $ 971,875 $ 1,391,594 10% Annual Discount for Estimated Timing of Cash Flows $ (297,170) $ (486,532) $ (280,116) Standardized Measure of Discounted Future Net Cash Flows $ 312,280 $ 485,343 $ 691,759 Changes in the Standardized Measure of Discounted Future Net Cash Flows at 10% per annum follow: DECEMBER 31, (US$000s) 2024 2023 2022 Beginning of Period $ 485,343 $ 681,759 $ 596,345 Net Change in Prices and Production Costs (186,434) (131,822) 104,888 Net Change in Future Development Costs 16,585 5,418 7,586 Sales, Net of Royalties and Production Costs (69,782) (111,213) (160,919) Extensions — — — Acquisition of Reserves — 14,687 31,323 Divestiture of Reserves — (225,273) — Revisions of Previous Quantity Estimates (99,114) 90,345 37,520 Previously Estimated Development Costs Incurred 26,792 29,155 8,482 Net Change in Taxes 64,171 49,379 15,203 Accretion of Discount 60,844 75,297 78,402 Changes in Timing and Other 13,875 7,611 (37,071) End of Period $ 312,280 $ 485,343 $ 681,759